library(unhcrdatapackage)
#> Registered S3 methods overwritten by 'ggalt':
#>   method                  from
#>   grid.draw.absoluteGrob  ggplot2
#>   grobHeight.absoluteGrob ggplot2
#>   grobWidth.absoluteGrob  ggplot2
#>   grobX.absoluteGrob      ggplot2
#> grobY.absoluteGrob ggplot2Population Data
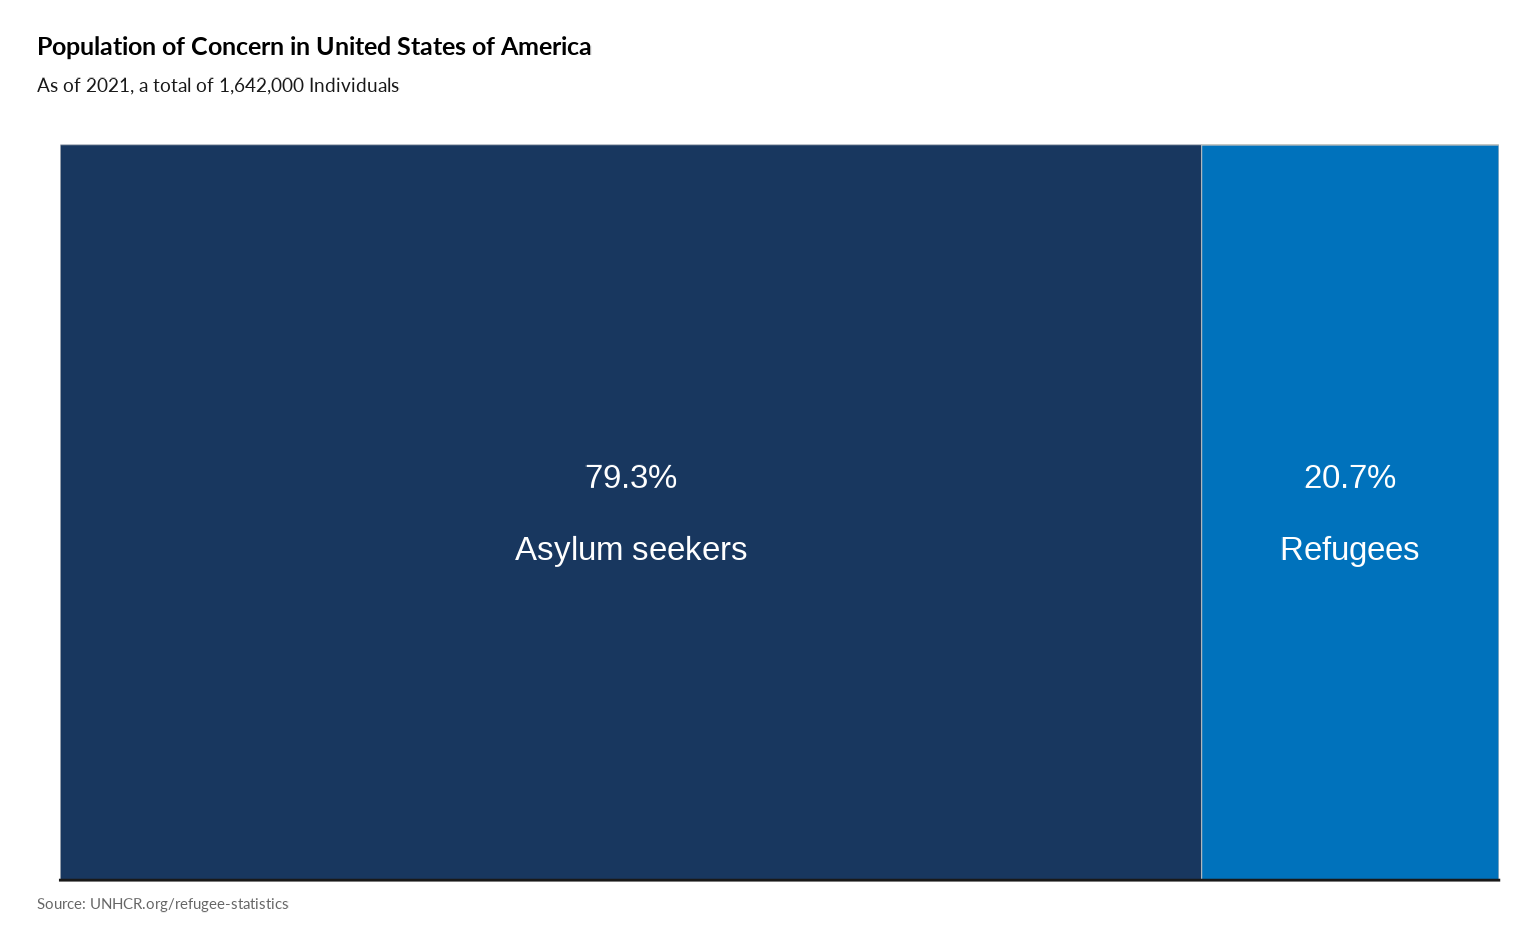
Plot Tree Map of Categories
#
plot_ctr_treemap(year = 2021,
                            country_asylum_iso3c = "USA",
                            pop_type = c("REF", "ASY")
         )
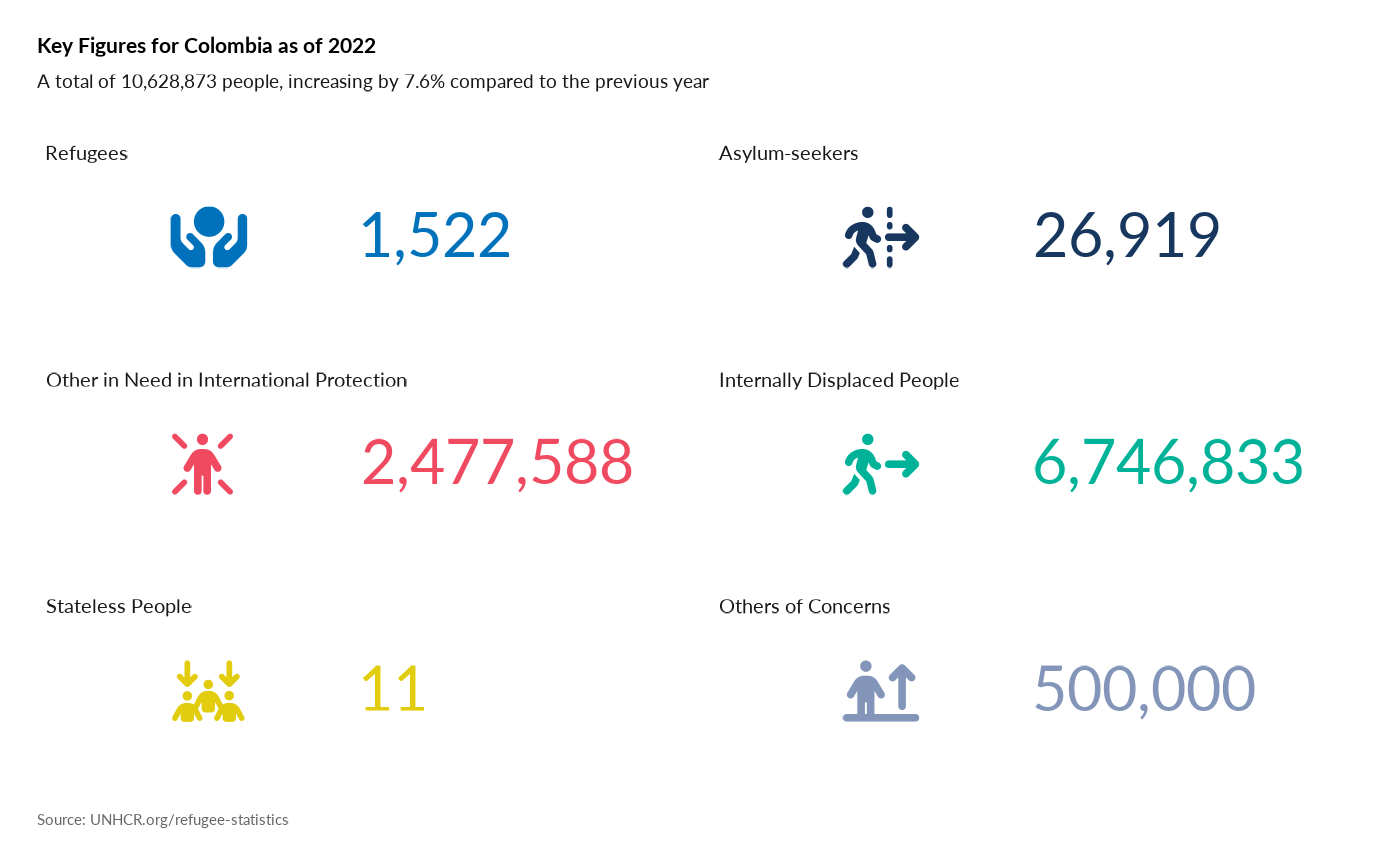
Plot Population type per year
p <- plot_ctr_population_type_per_year(
                         year = 2022,
                         lag = 5,
                         country_asylum_iso3c = "PAN",
                         pop_type = c("REF",
                                       "ASY",
                                       "OIP",
                                       "OOC",
                                       "STA",
                                       "IDP" )
                  )
p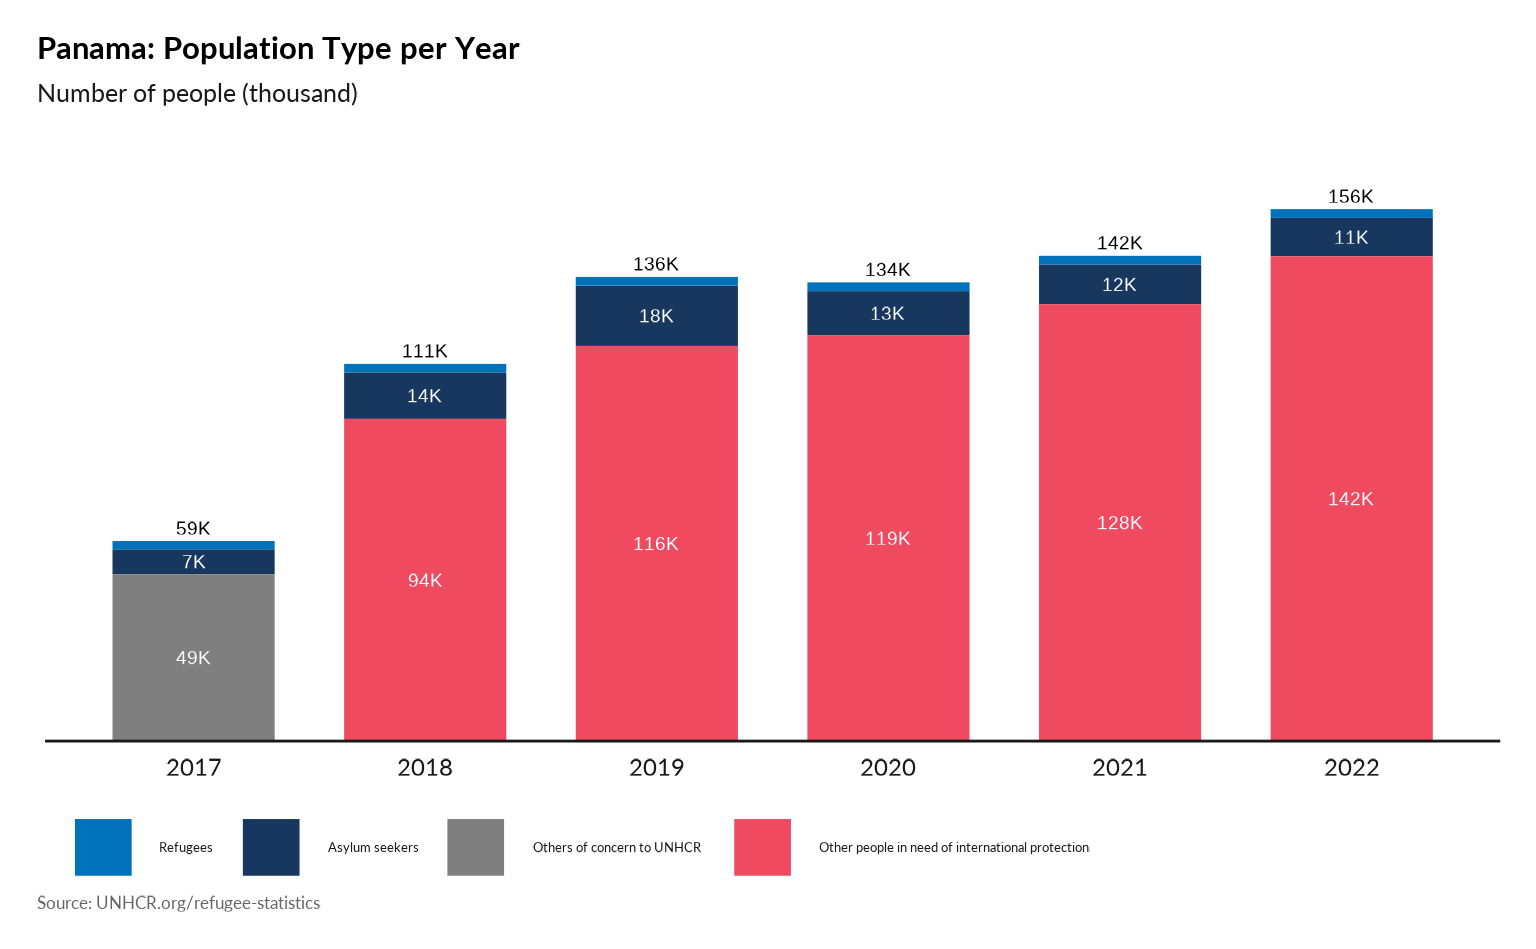
## Raw data can always be accessed with
#knitr::kable(ggplot2::ggplot_build(p)$plot$data )
Plot Main country of origin in one specific country - Absolute value
plot_ctr_population_type_abs(year = 2020,
                    country_asylum_iso3c = "USA",
                    top_n_countries = 4,
                    pop_type = "REF",
                    show_diff_label = FALSE
                    )
#> Warning: There was 1 warning in `mutate()`.
#> ℹ In argument: `origin_data_prot = forcats::fct_explicit_na(origin_data_prot,
#>   "Other nationalities")`.
#> Caused by warning:
#> ! `fct_explicit_na()` was deprecated in forcats 1.0.0.
#> ℹ Please use `fct_na_value_to_level()` instead.
#> ℹ The deprecated feature was likely used in the unhcrdatapackage package.
#>   Please report the issue at
#>   <https://github.com/edouard-legoupil/unhcrdatapackage/issues>.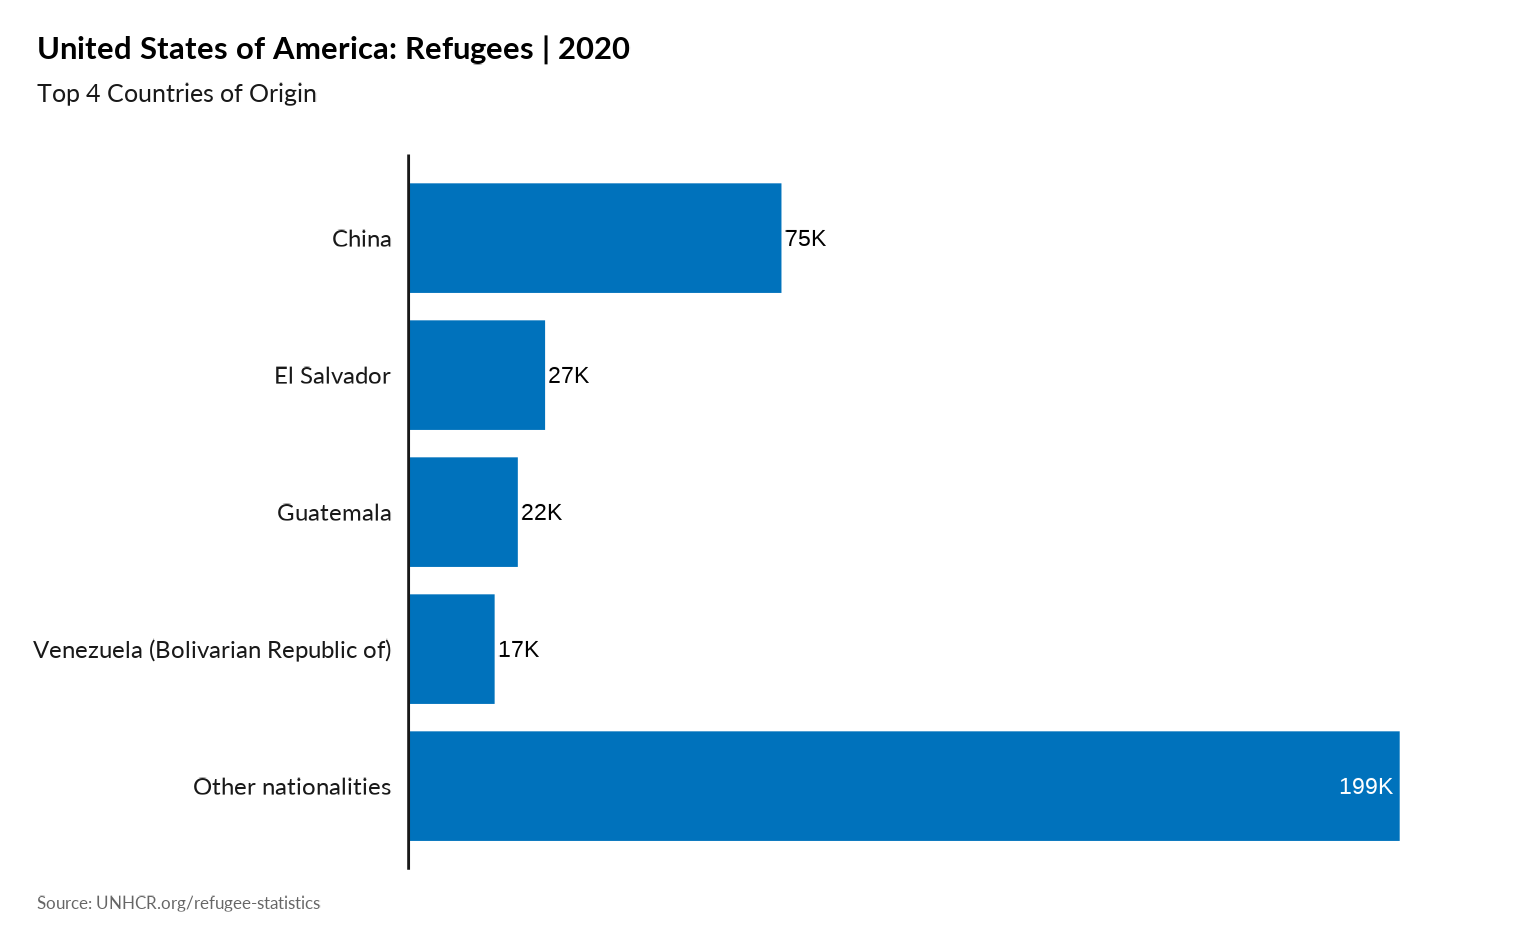
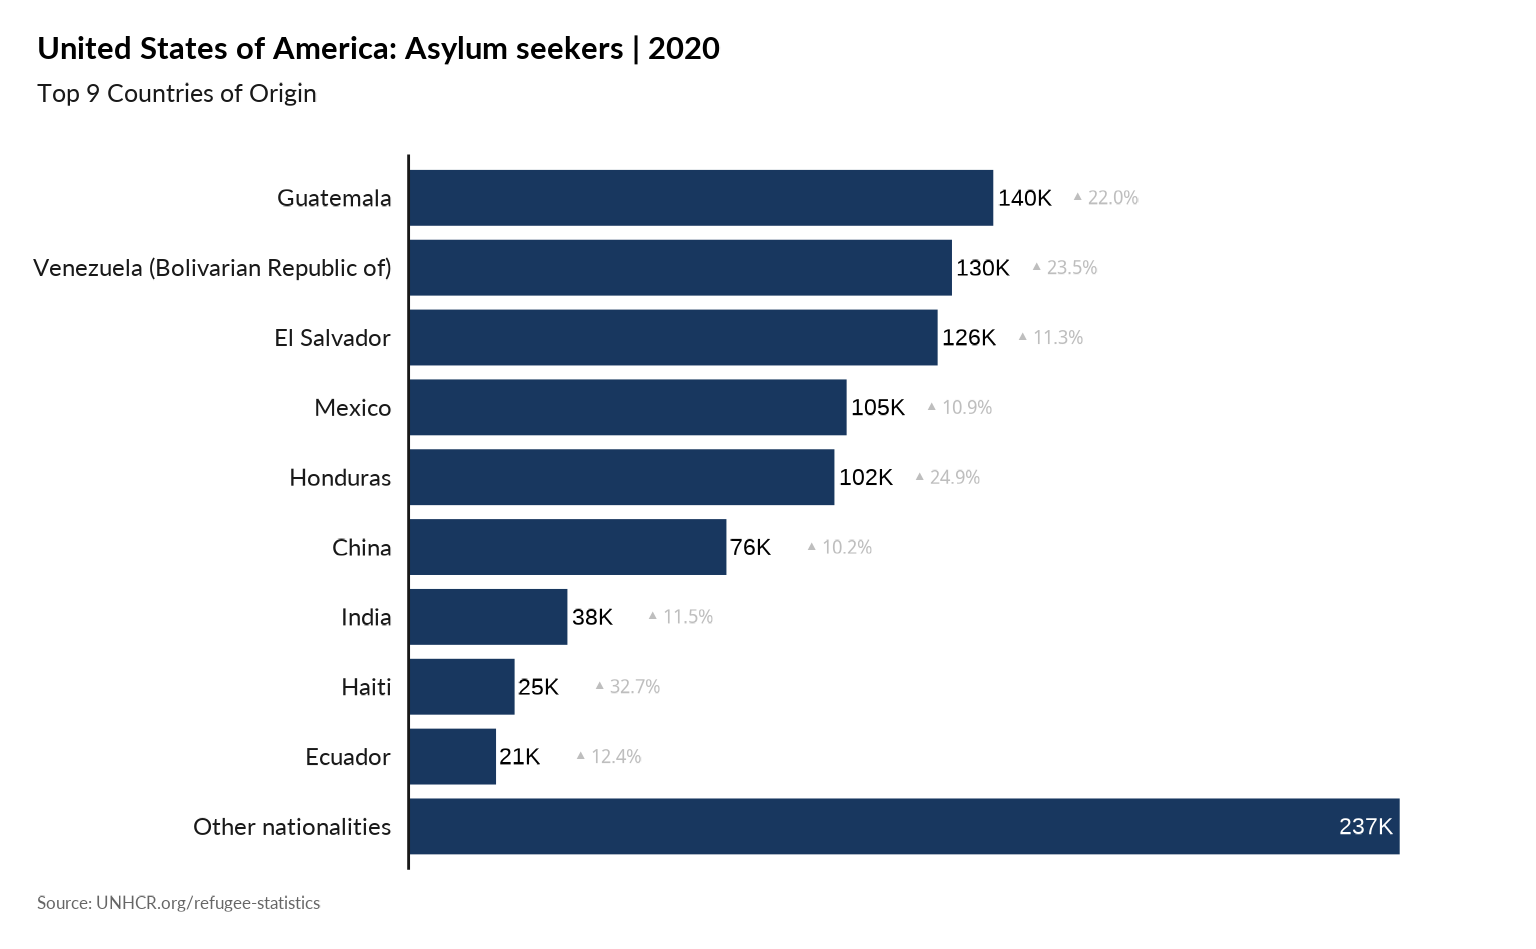
## Same with 9 top countries and asylum seekers included
plot_ctr_population_type_abs(year = 2020,
                    country_asylum_iso3c = "USA",
                    top_n_countries = 9,
                    pop_type = "ASY",
                    show_diff_label = TRUE
) 
Plot Main country of origin in one specific country - Percentage
plot_ctr_population_type_perc(year = 2021,
                    country_asylum_iso3c = "BRA",
                    top_n_countries = 9,
pop_type = "REF" ) 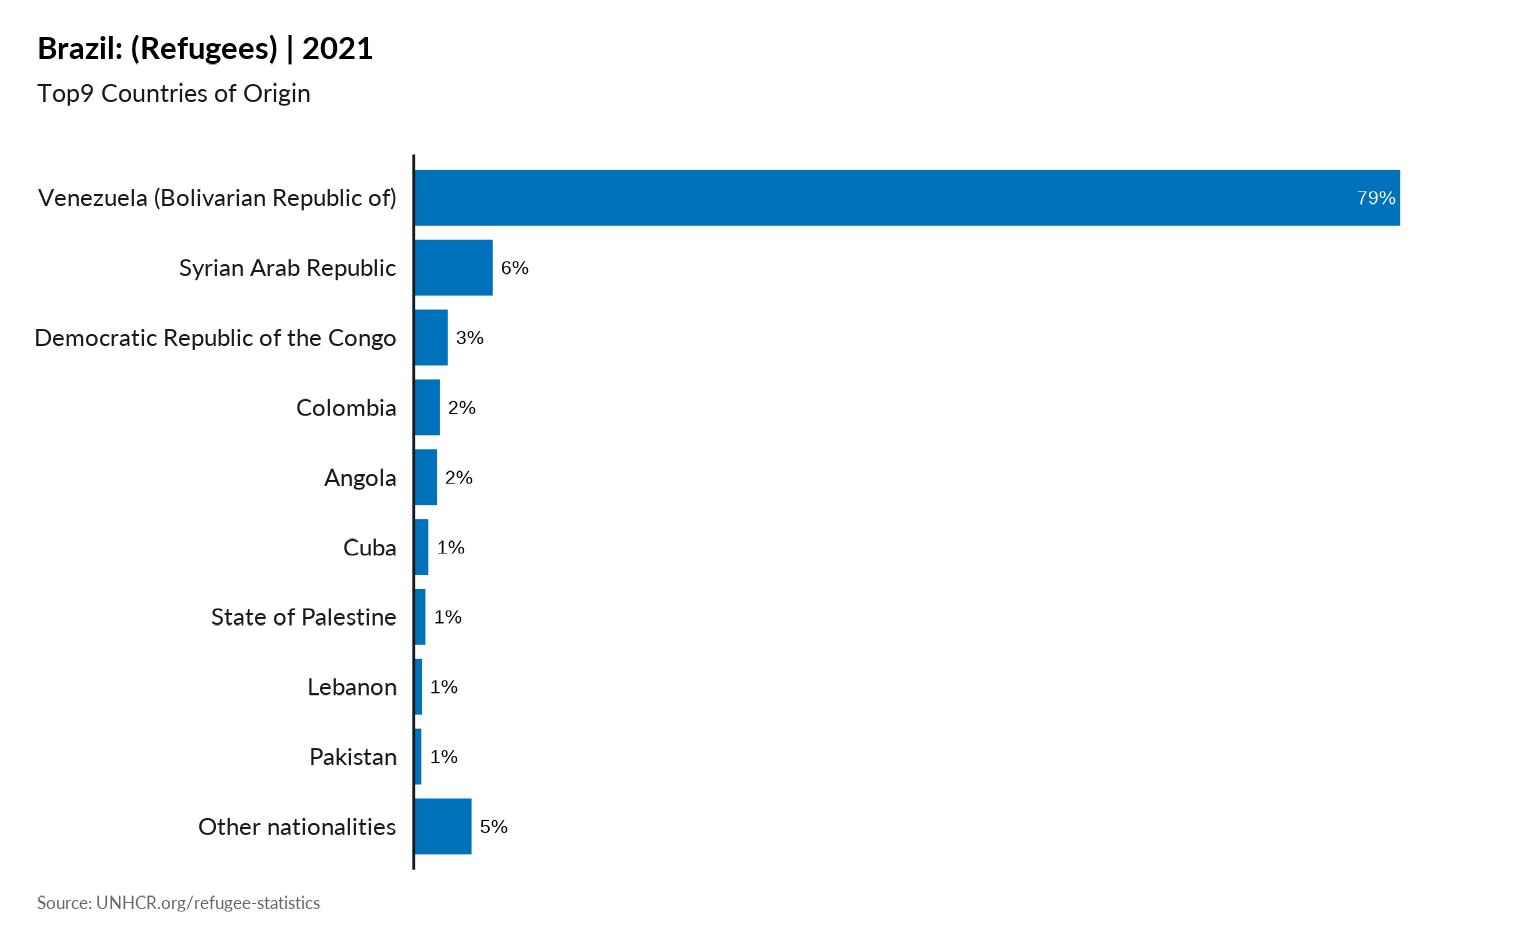
plot_ctr_population_type_perc(year = 2021,
                    country_asylum_iso3c = "BRA",
                    top_n_countries = 9,
pop_type = "ASY" ) 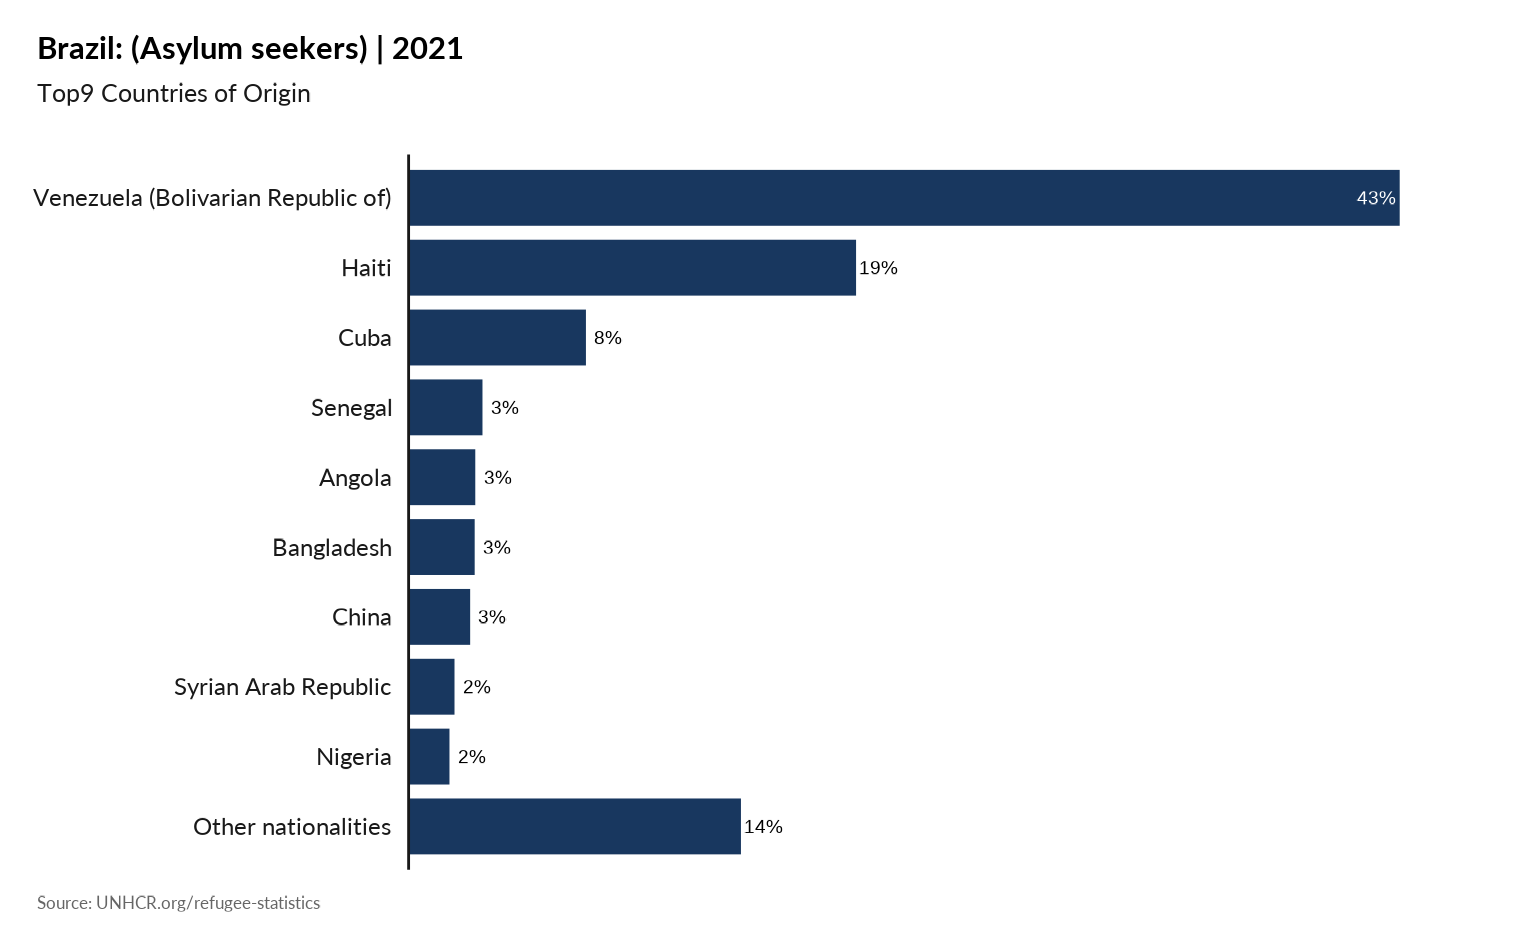
Plot Increases and Decreases in Population Groups
#
plot_ctr_diff_in_pop_groups(year = 2022,
                            country_asylum_iso3c = "ARG",
                            pop_type = c("REF", "ASY")
         )
#> Warning: Returning more (or less) than 1 row per `summarise()` group was deprecated in
#> dplyr 1.1.0.
#> ℹ Please use `reframe()` instead.
#> ℹ When switching from `summarise()` to `reframe()`, remember that `reframe()`
#>   always returns an ungrouped data frame and adjust accordingly.
#> ℹ The deprecated feature was likely used in the unhcrdatapackage package.
#>   Please report the issue at
#>   <https://github.com/edouard-legoupil/unhcrdatapackage/issues>.
#> This warning is displayed once every 8 hours.
#> Call `lifecycle::last_lifecycle_warnings()` to see where this warning was
#> generated.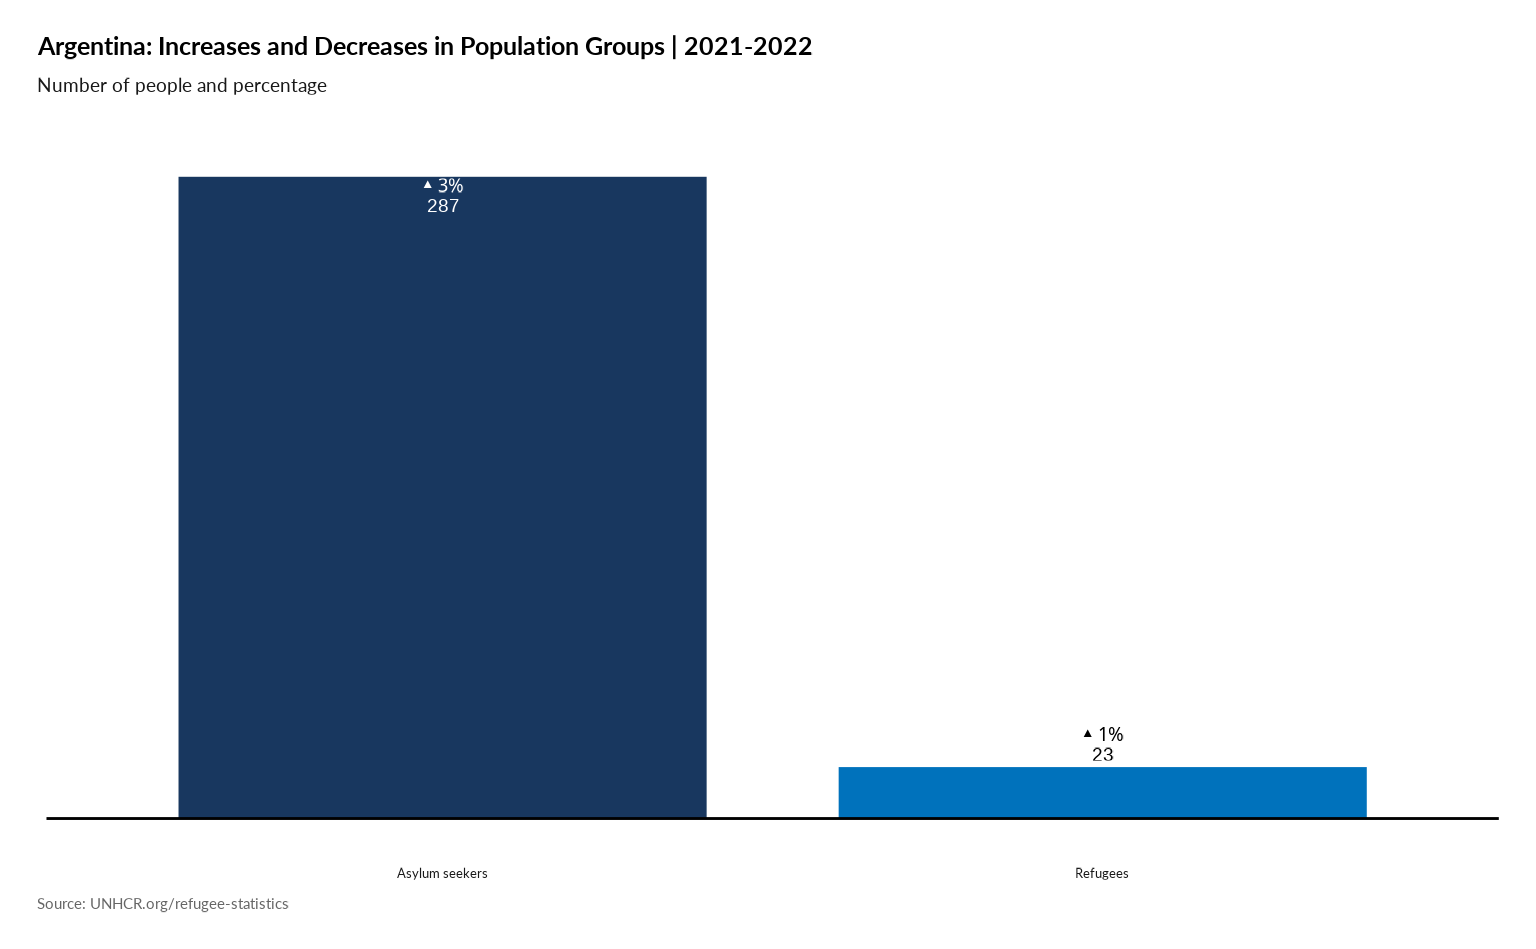
Plot Origin History
plot_ctr_origin_history(year = 2022,
                        lag = 5,
                        country_asylum_iso3c = "MEX",
                          pop_type = c("REF",
                                       "ASY",
                                       "OIP",
                                       "IDP" ),
                        otherprop = .02)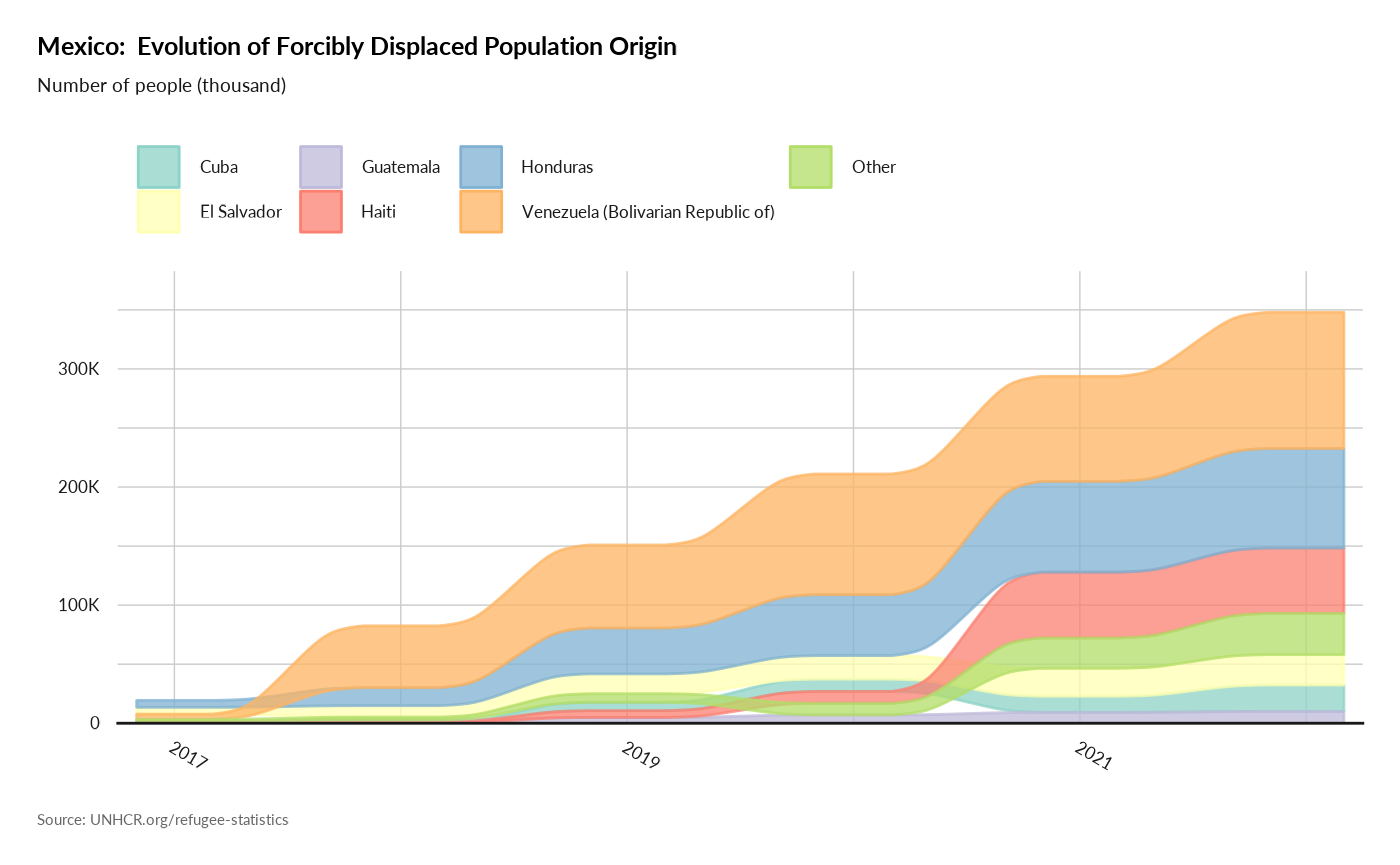
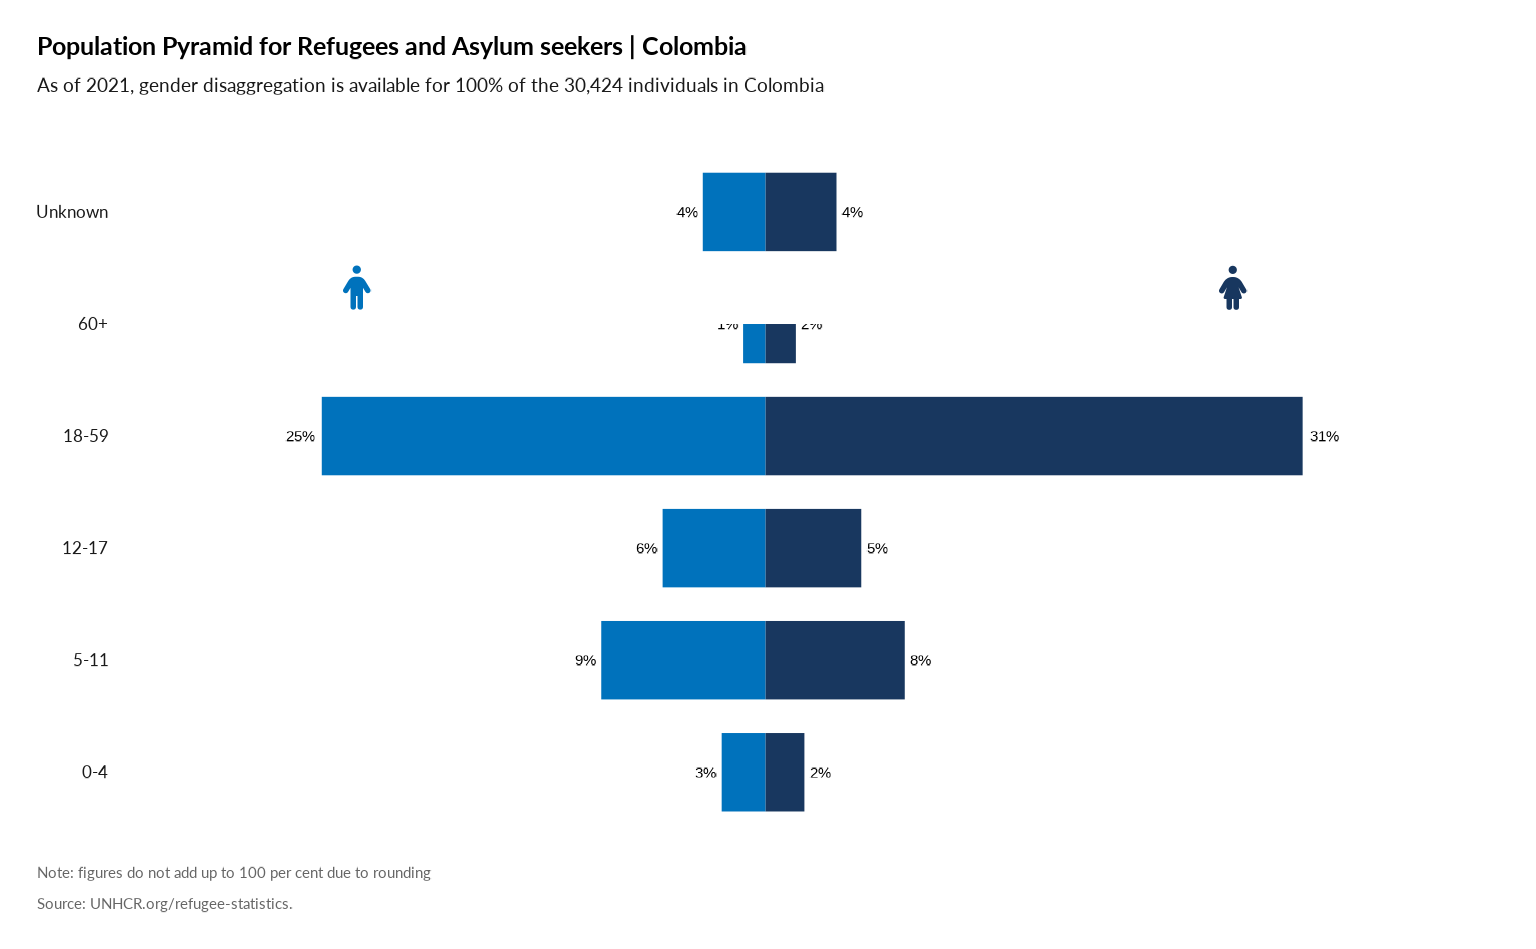
Plot Age Pyramid
#
plot_ctr_pyramid(year = 2022,
                 country_asylum_iso3c = "COL",
                 pop_type = c("ASY", "REF")
                 )
Maps
Plot locations within countries
plot_ctr_location(year = 2022,
                 country_asylum_iso3c = "COL",
                 pop_type = c("ASY", "REF", "OIP"))
#> Coordinate system already present. Adding new coordinate system, which will
#> replace the existing one.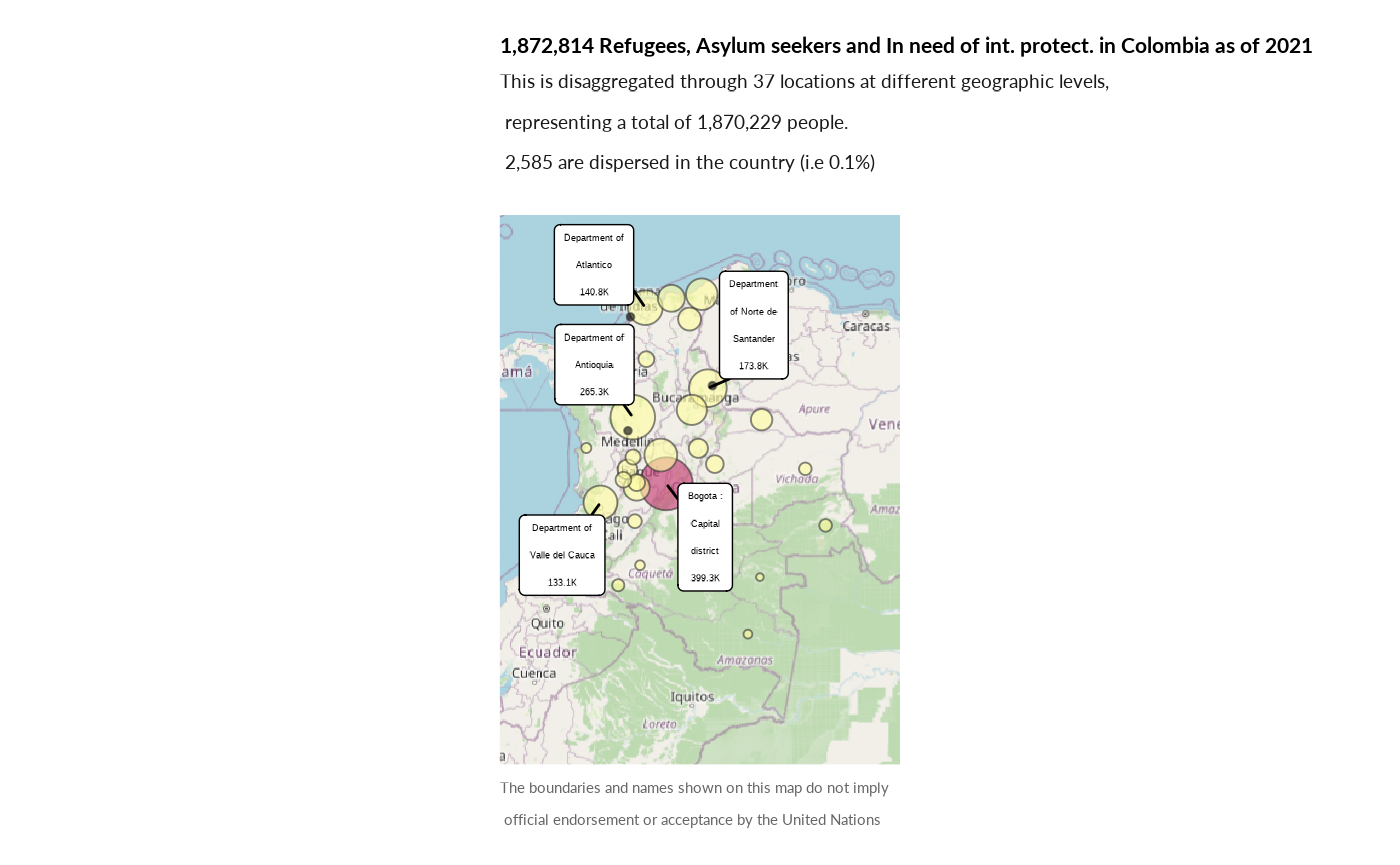
plot_ctr_location(year = 2021,
                 country_asylum_iso3c = "COL",
                 pop_type = c("IDP"))
#> Coordinate system already present. Adding new coordinate system, which will
#> replace the existing one.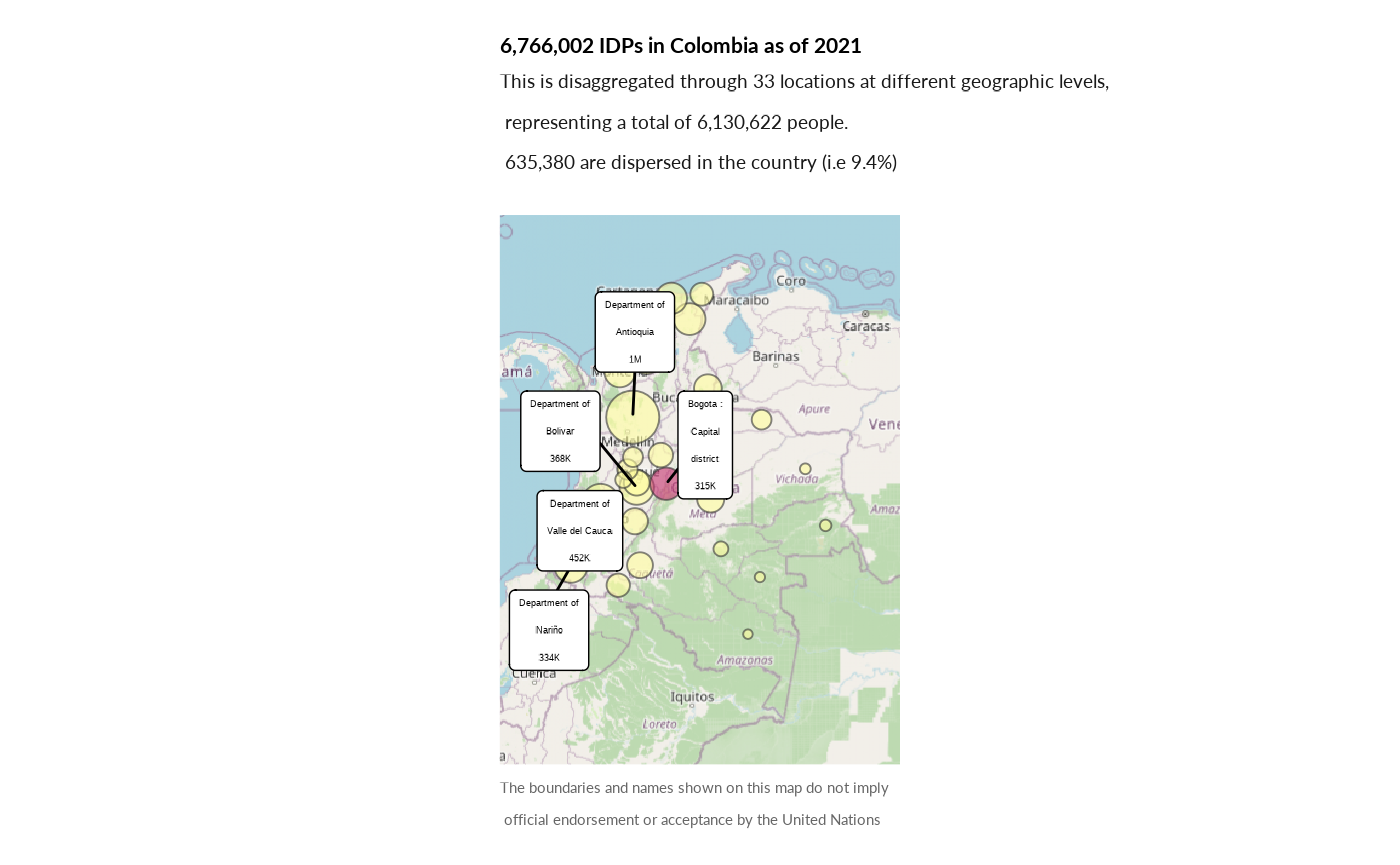
plot_ctr_location(year = 2022,
                 country_asylum_iso3c = "CAN",
                 pop_type = c("ASY", "REF", "OIP"))
#> Coordinate system already present. Adding new coordinate system, which will
#> replace the existing one.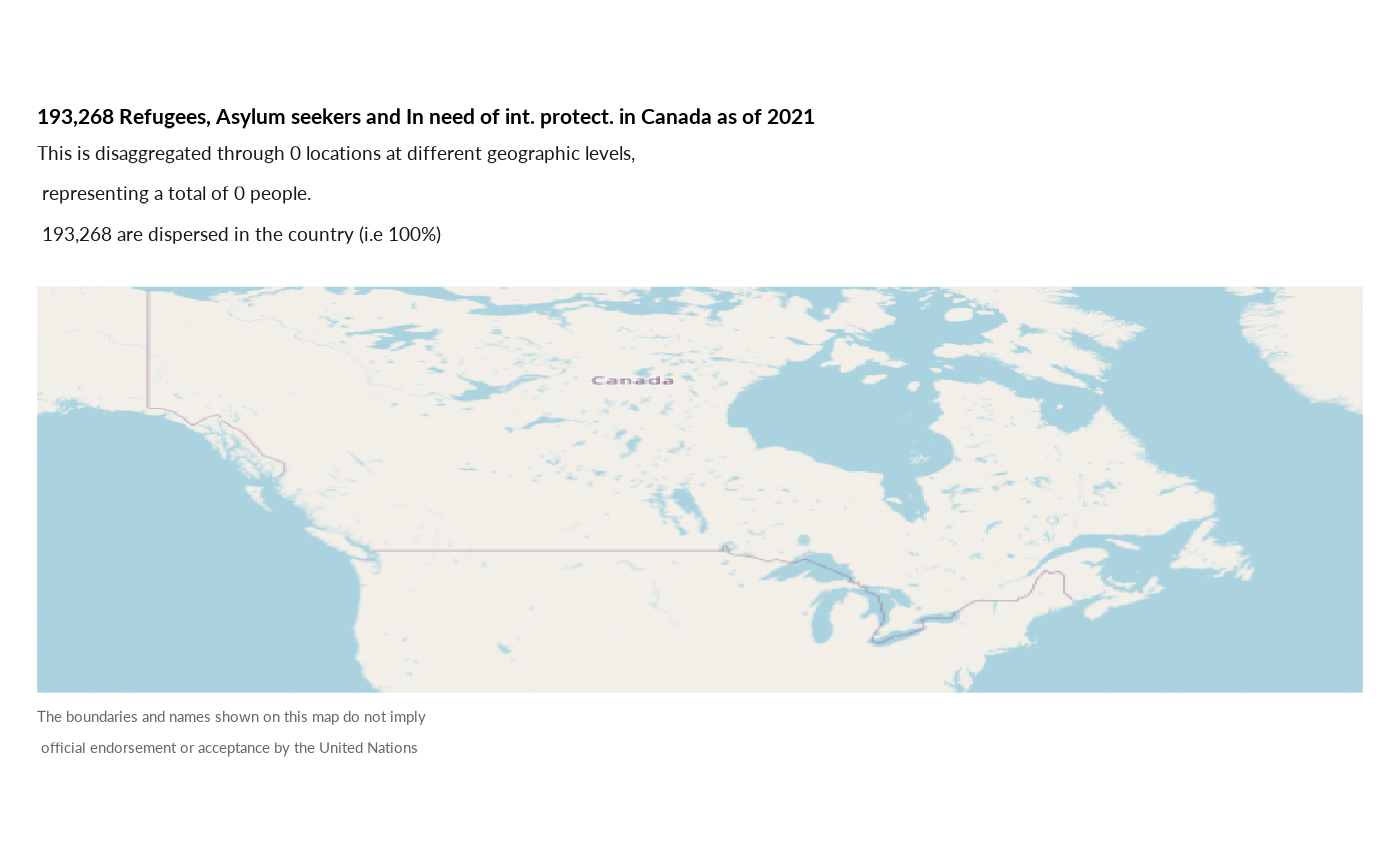
plot_ctr_location(year = 2021,
                 country_asylum_iso3c = "MEX",
                 pop_type = c("ASY", "REF", "OIP"))
#> Coordinate system already present. Adding new coordinate system, which will
#> replace the existing one.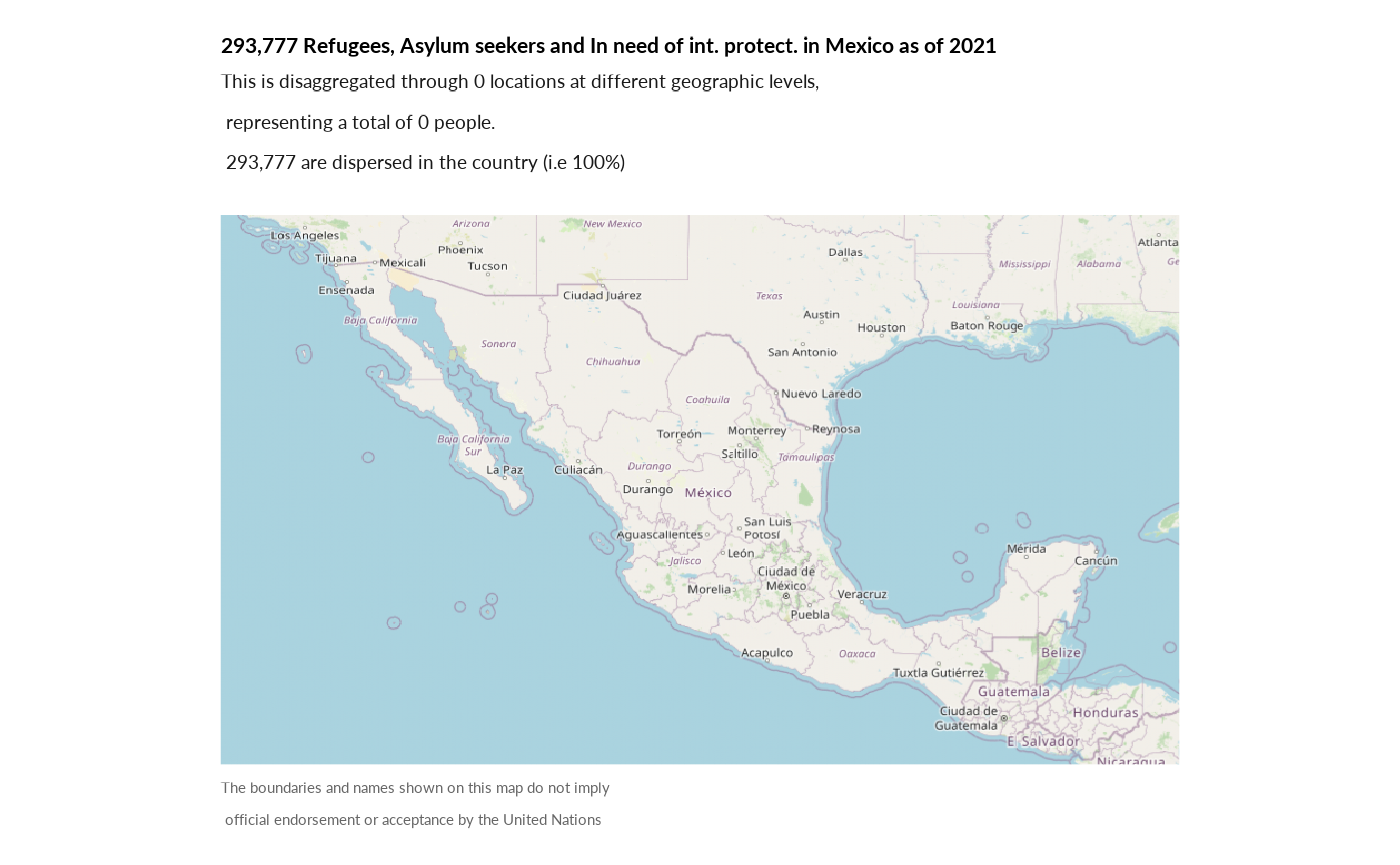
Refugee Status Determination
Plot Refugee Recognition rate in Country
plot_ctr_recognition(year = 2022,
                     country_asylum_iso3c = "USA",
                     top_n_countries = 10,
                     measure = "RefugeeRecognitionRate",
                     order_by = "TotalDecided" )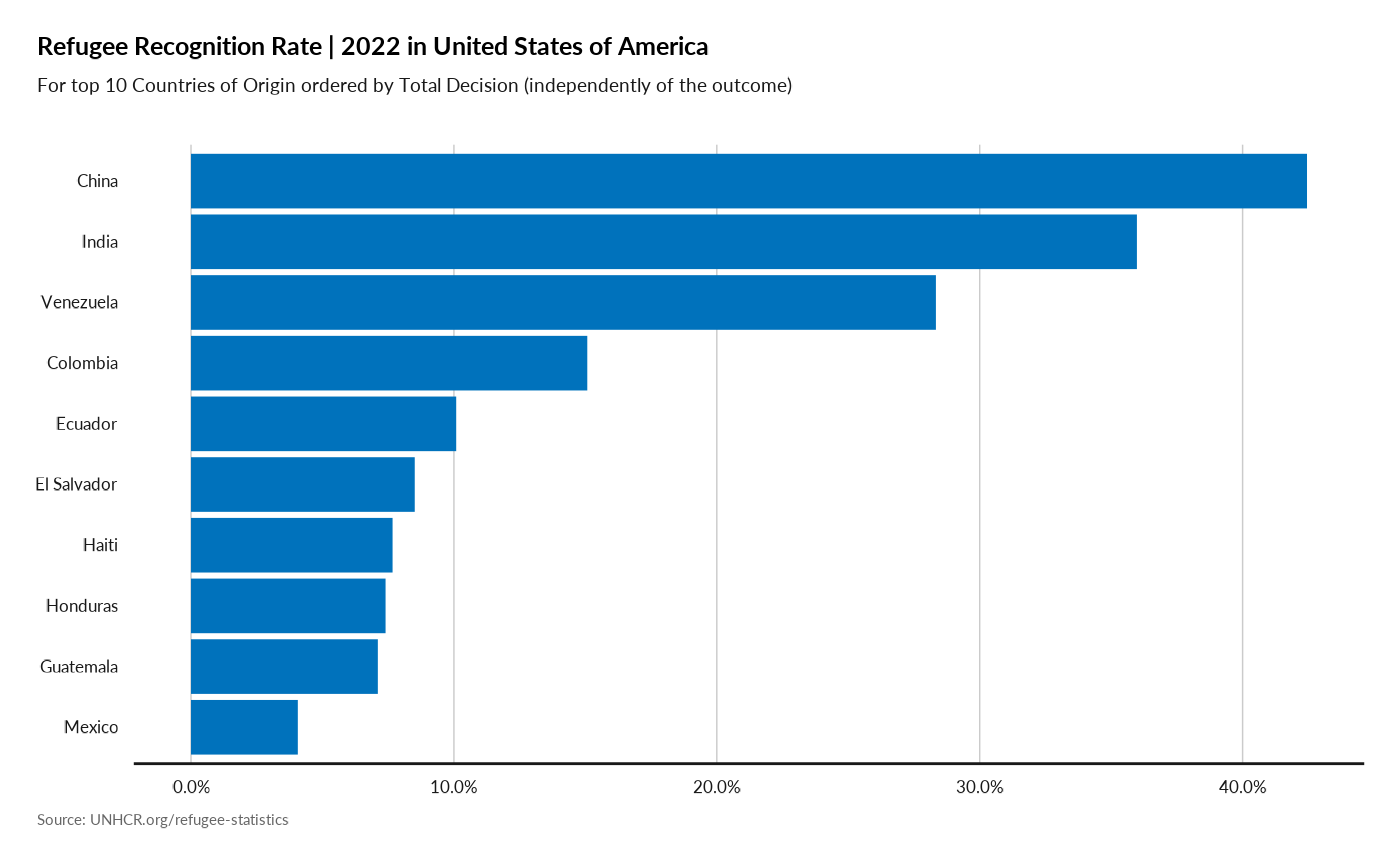
Asylum Applications & Decision over time
plot_ctr_asylum(year = 2022,
                country_asylum_iso3c = "ECU",
                            lag = 10)
#> Joining with `by = join_by(Year, CountryAsylumCode)`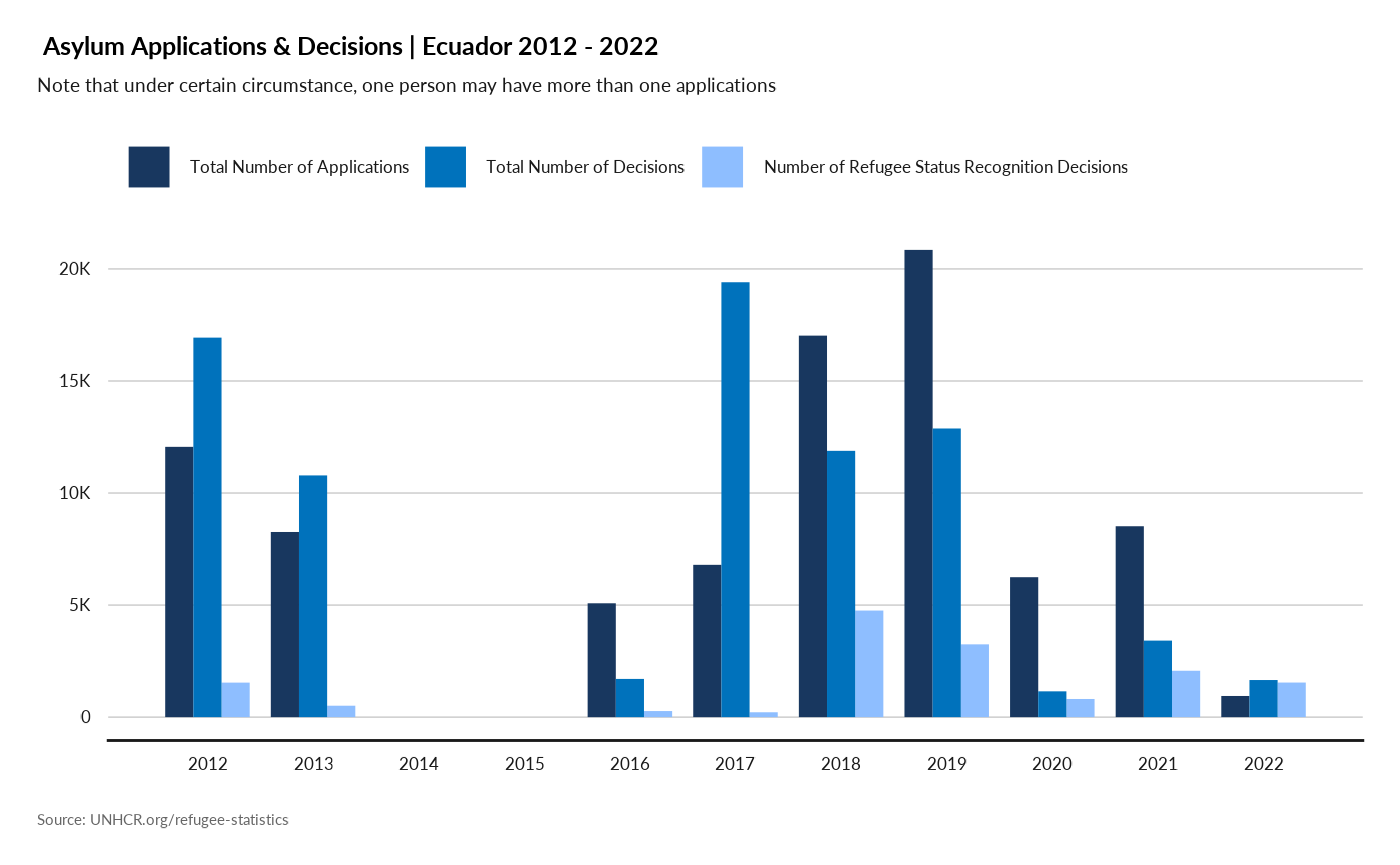
Asylum Processing
plot_ctr_process(year = 2022, country_asylum_iso3c = "BOL")
plot_ctr_process(year = 2022, country_asylum_iso3c = "CHL")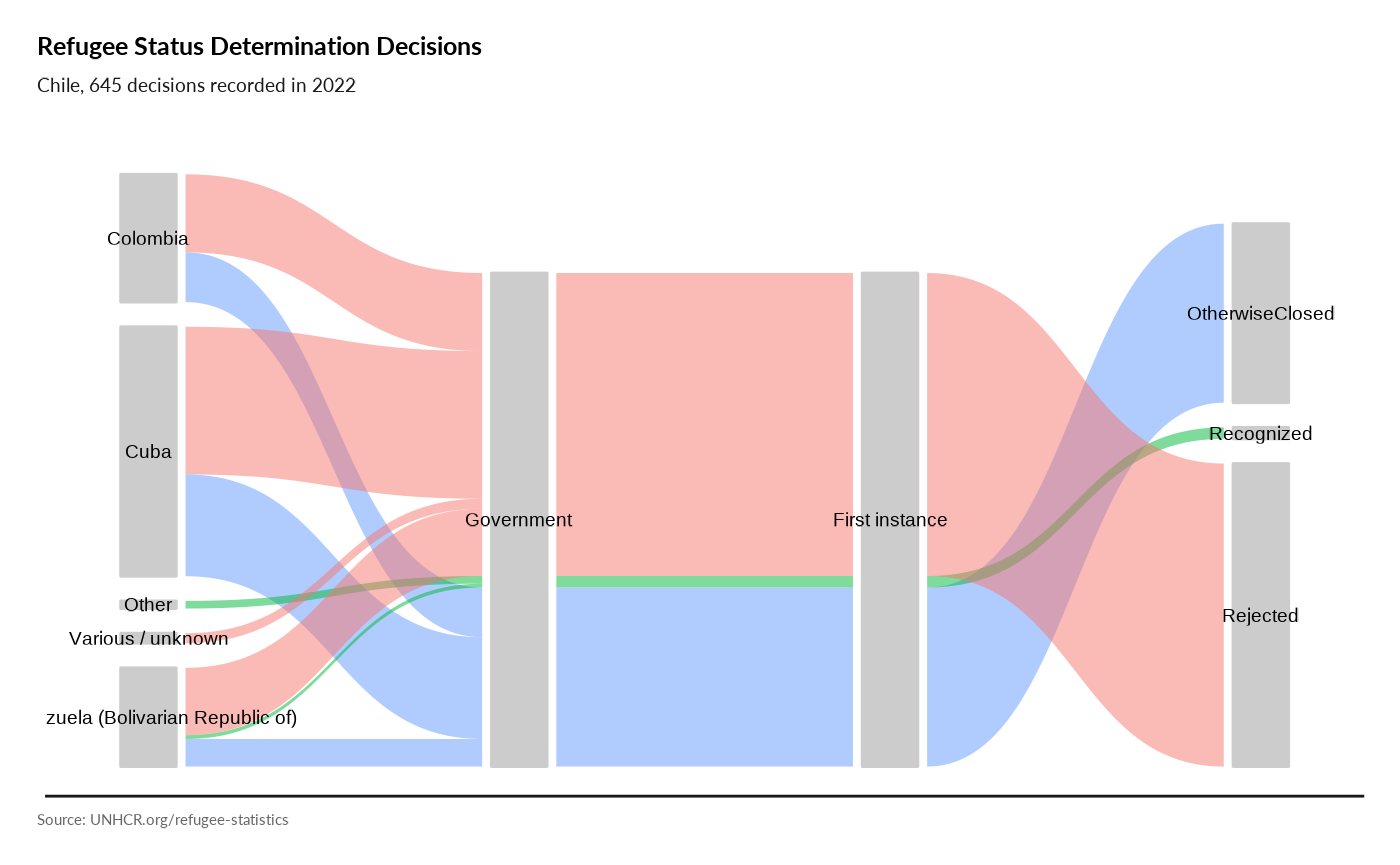
plot_ctr_process(year = 2022,   country_asylum_iso3c = "USA",
                              otherprop = .02)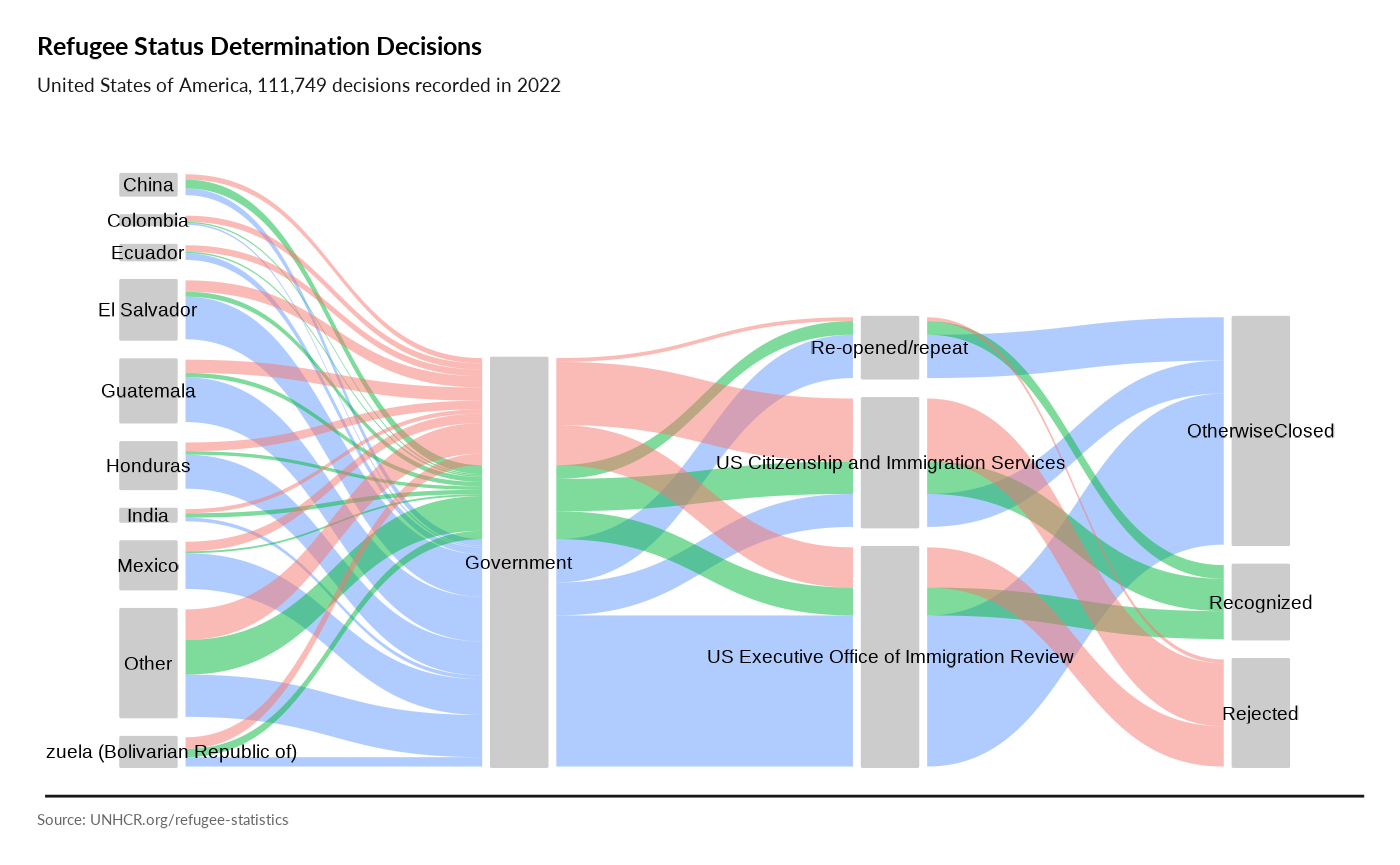
plot_ctr_process(year = 2022,   country_asylum_iso3c = "USA",
                              otherprop = .04)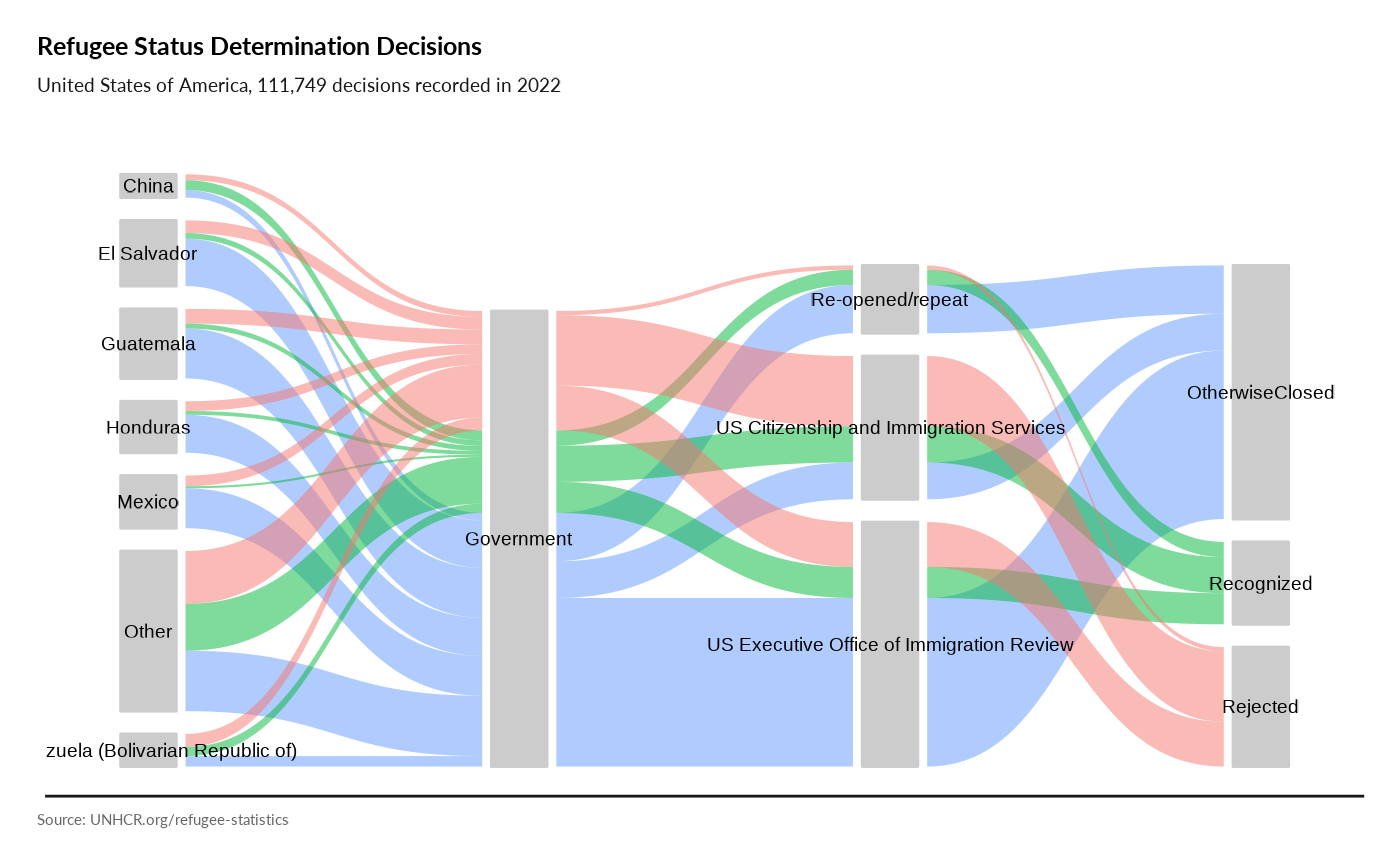
Average Asylum Processing Time
plot_ctr_processing_time(year = 2022,
                         country_asylum_iso3c = "ARG")
#> Joining with `by = join_by(Year, CountryAsylumCode)`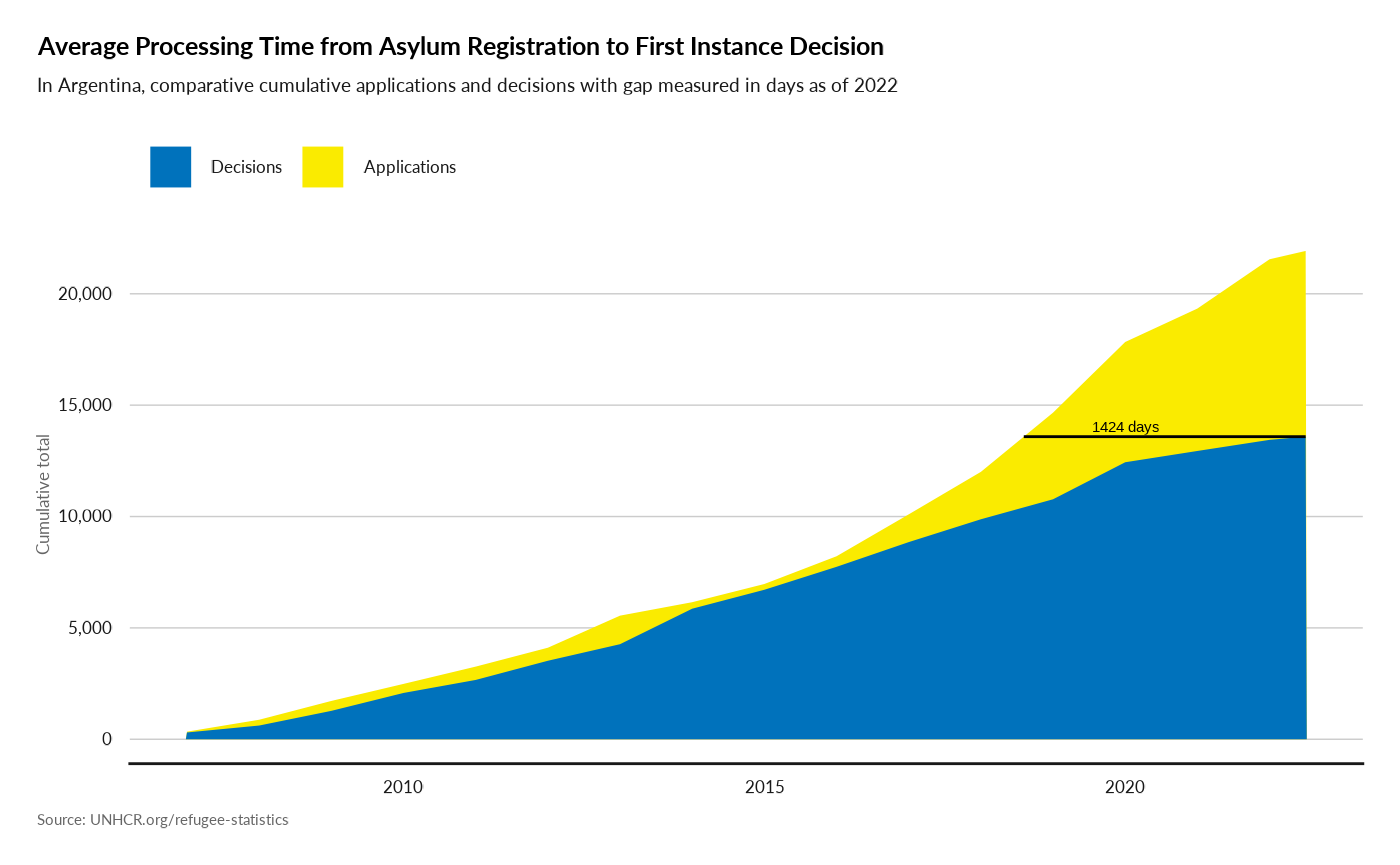
plot_ctr_processing_time(year = 2022,
                         country_asylum_iso3c = "USA")
#> Joining with `by = join_by(Year, CountryAsylumCode)`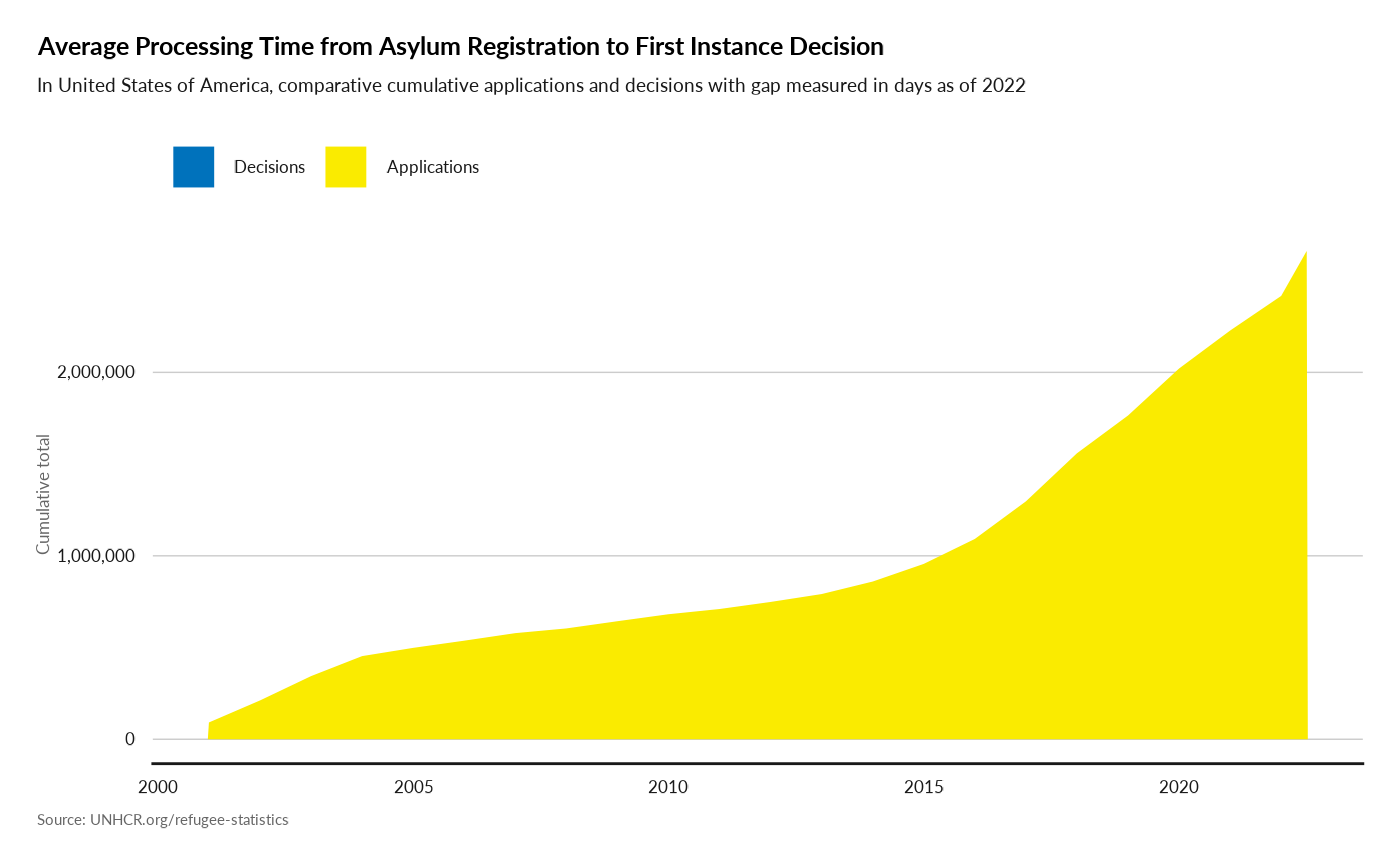
## Display a filtered version of the chart for a specific country and procedure
plot_ctr_processing_time(year = 2022,
                         country_asylum_iso3c = "EGY",
                         country_origin_iso3c = "ERI",
                         procedureType = "U")
#> Joining with `by = join_by(Year, CountryAsylumCode)`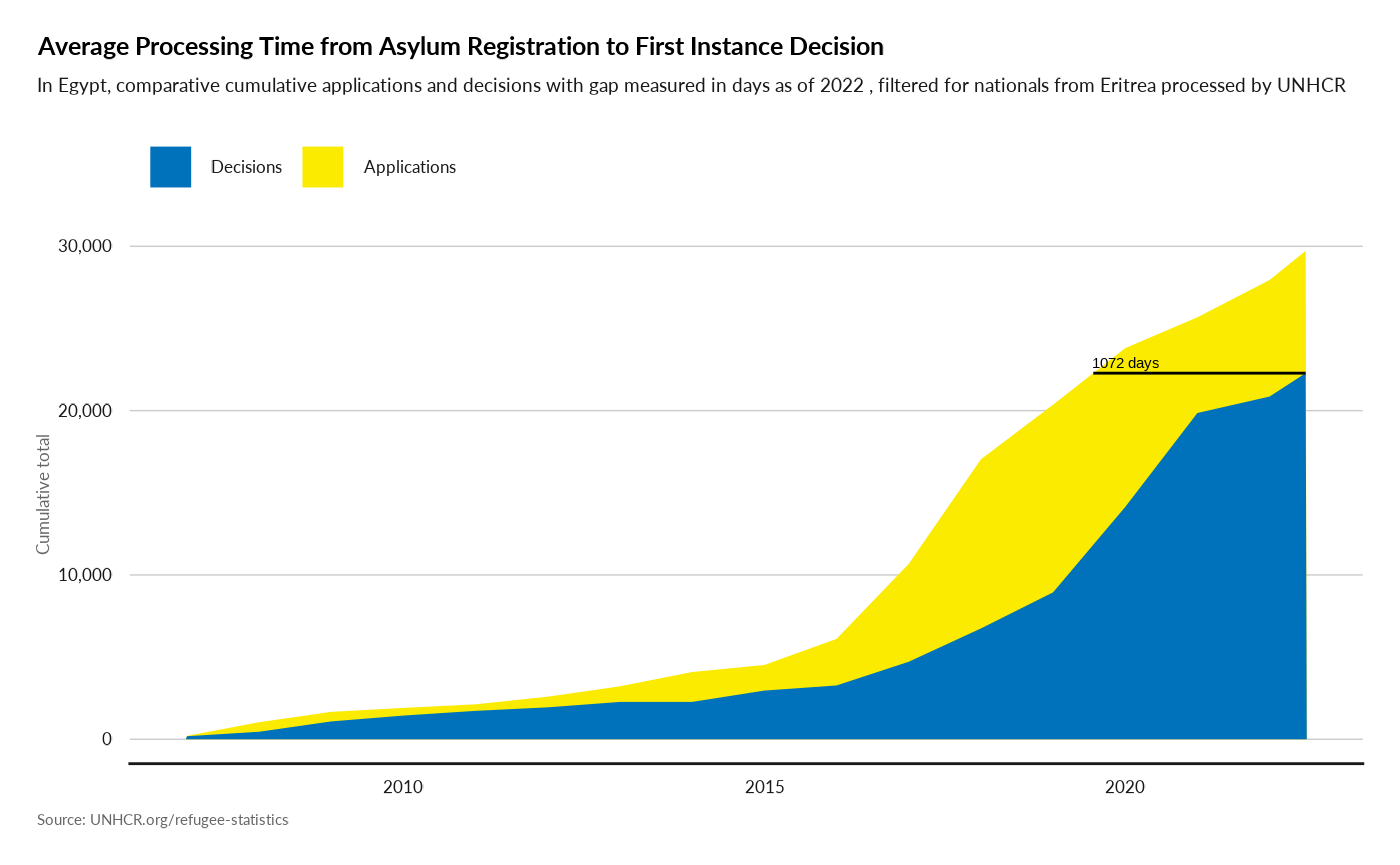
Solutions
Plot Solution Over time
plot_ctr_solution(year = 2021,
                  country_asylum_iso3c= "UGA",
                  pop_type = c("REF", "ASY"))
#> Warning: There was 1 warning in `mutate()`.
#> ℹ In argument: `valabel = ifelse(...)`.
#> ℹ In group 1: `Year = 2012`.
#> Caused by warning:
#> ! `label_number_si()` was deprecated in scales 1.2.0.
#> ℹ Please use the `scale_cut` argument of `label_number()` instead.
#> ℹ The deprecated feature was likely used in the unhcrdatapackage package.
#>   Please report the issue at
#>   <https://github.com/edouard-legoupil/unhcrdatapackage/issues>.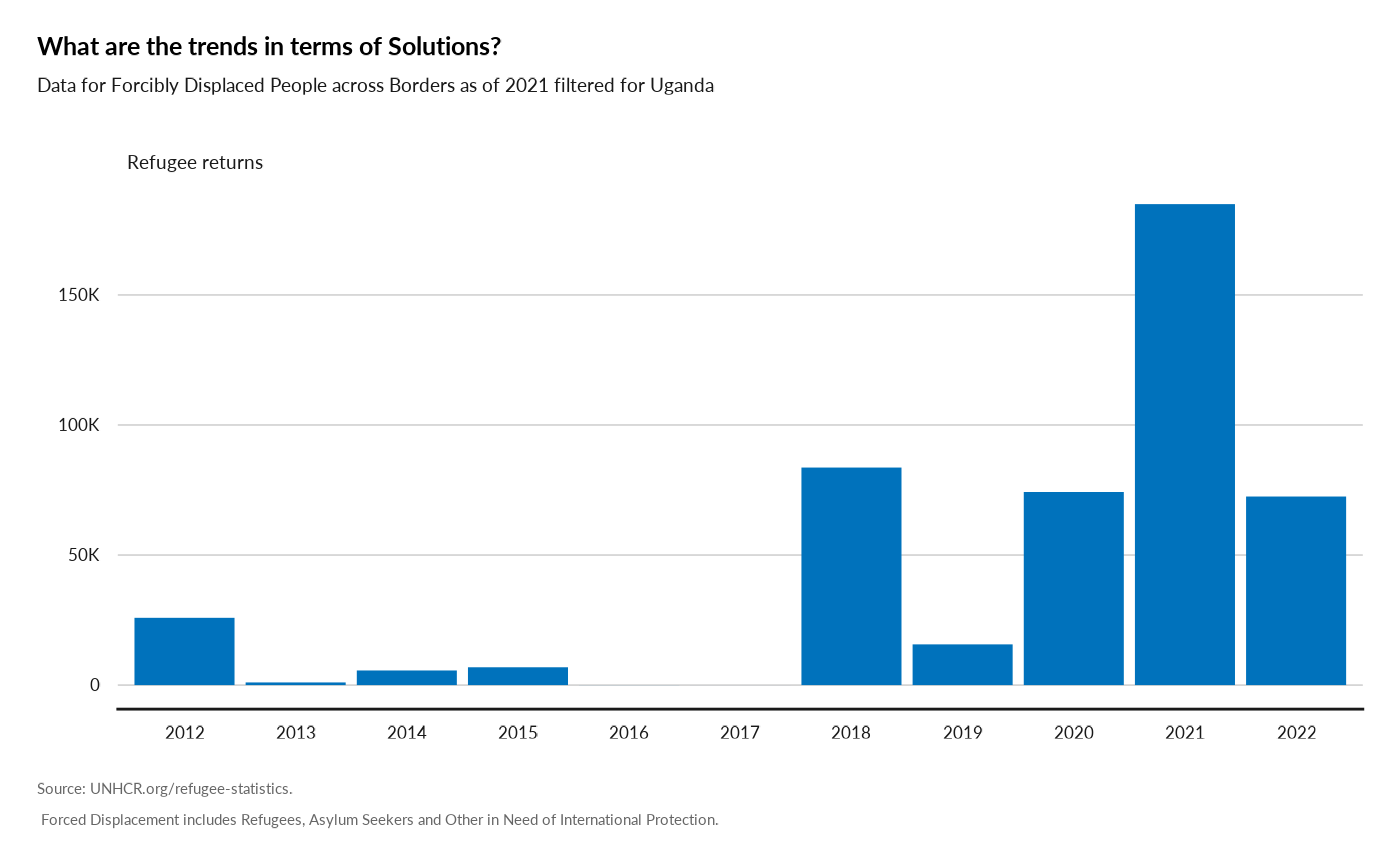
Forced Displacement and Migration
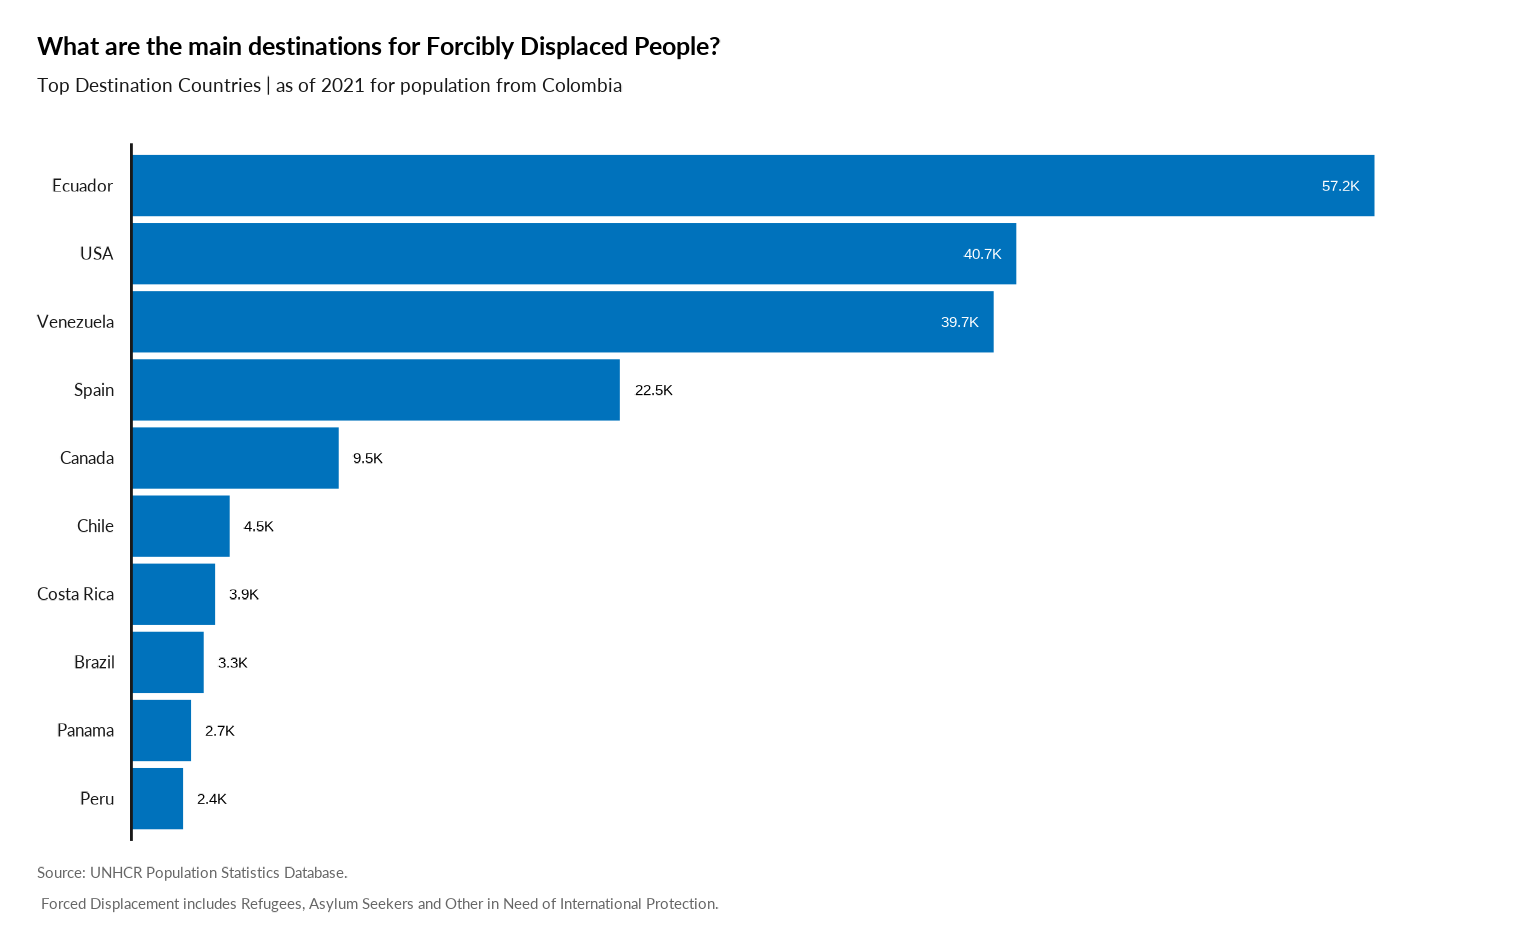
Plot Main Destination from one specific country
#
plot_ctr_destination(year = 2021,
                     country_origin_iso3c = "COL",
                     pop_type = c("REF", "ASY")
         )
plot recognition rate for a nationality
plot_ctr_origin_recognition(year = 2022,
                     country_origin_iso3c = "VEN",
                     top_n_countries = 10,
                     measure = "RefugeeRecognitionRate",
                     order_by = "TotalDecided" )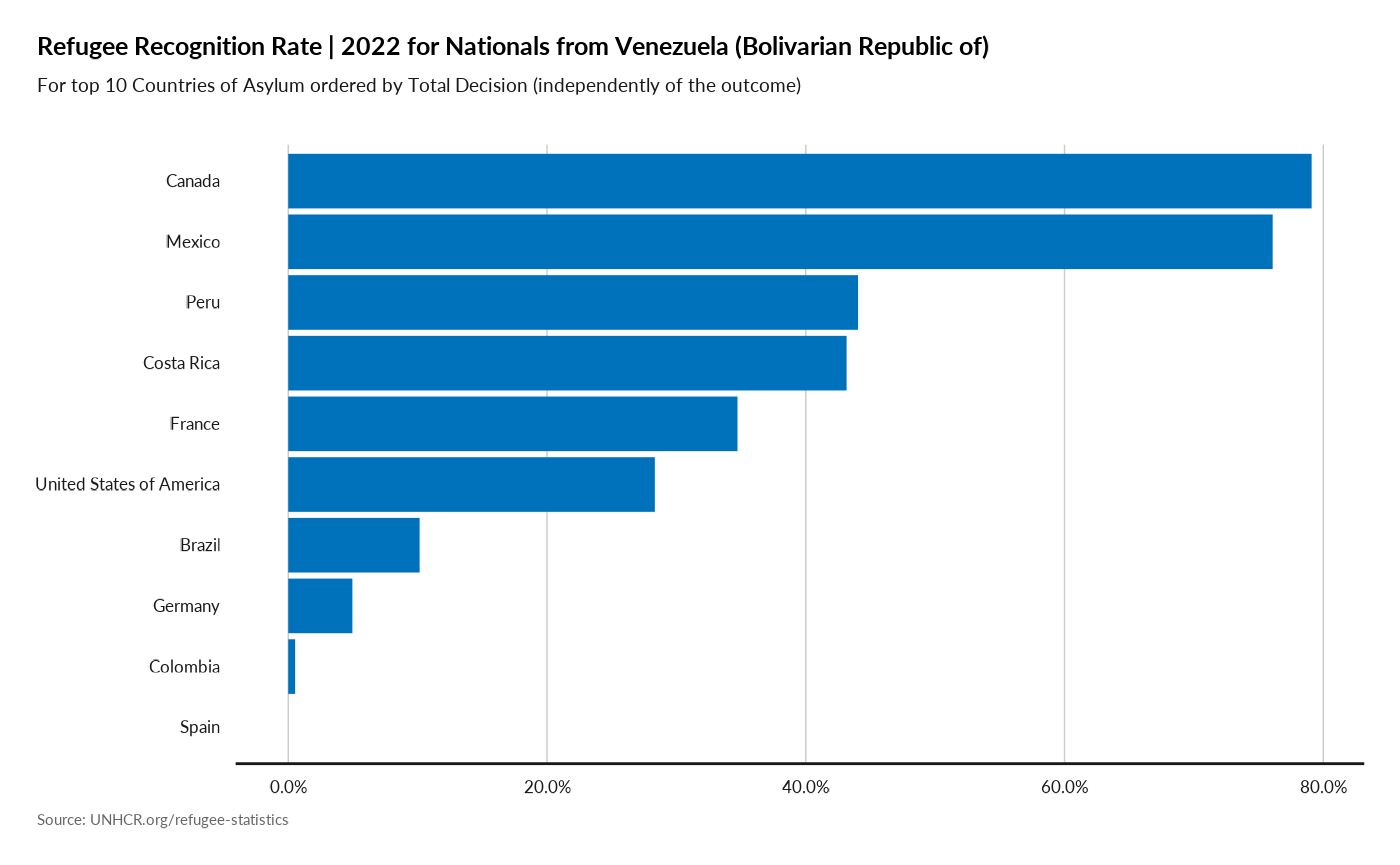
Plot Ratio Refugee Migrant
plot_ctr_disp_migrant(year = 2022,
                    country_asylum_iso3c = "MEX" )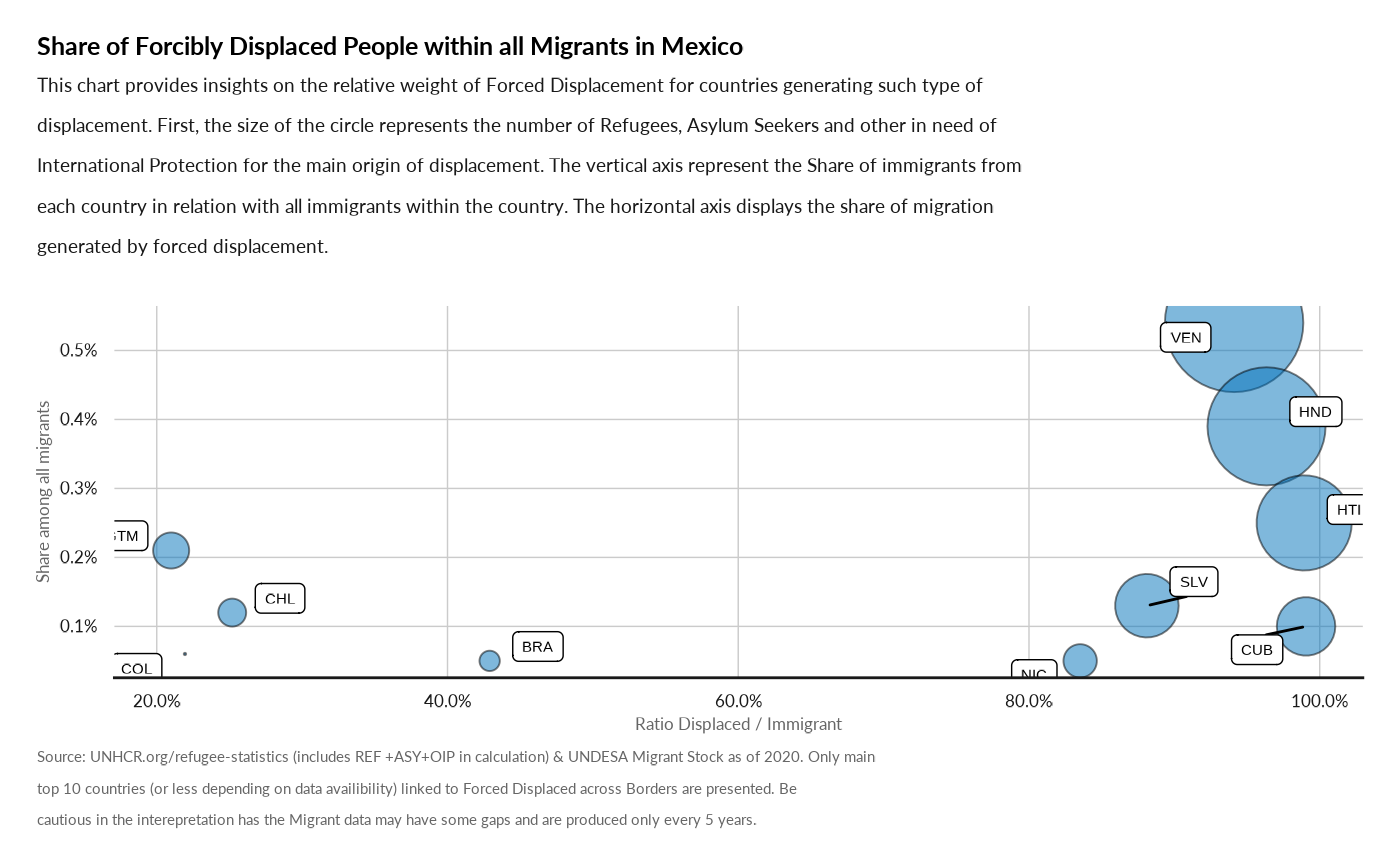
# plot_ctr_disp_migrant(year = 2022,
#                     country_asylum_iso3c = "FRA" )
Regional Questions
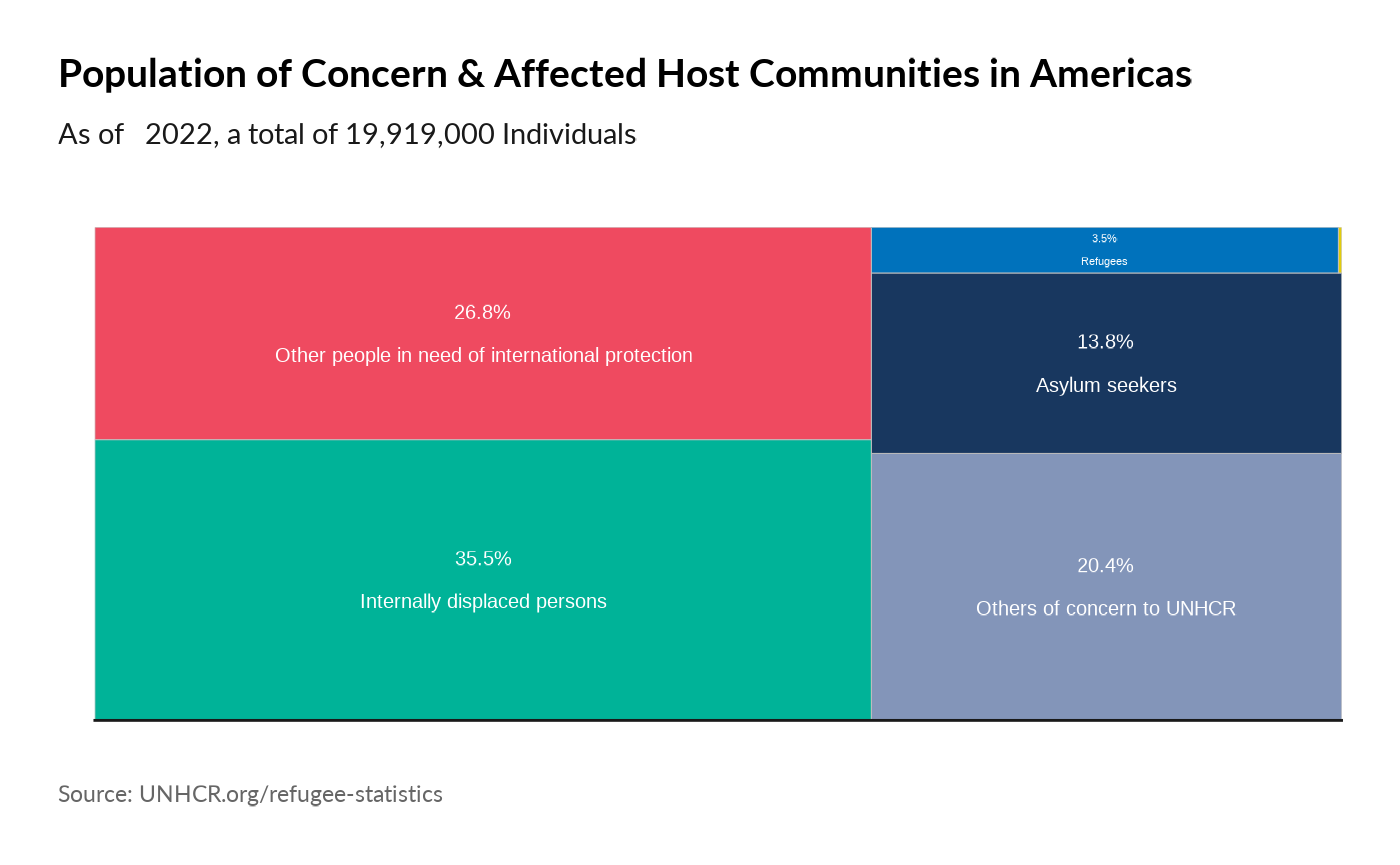
Plot World Comparison
plot_reg_share(year = 2022,
                             region = "Americas",
                             pop_type = "REF")
#> Warning: Use of `datatree$Value` is discouraged.
#> ℹ Use `Value` instead.
#> Use of `datatree$Value` is discouraged.
#> ℹ Use `Value` instead.
plot_reg_share(year = 2022,
                             region = "Americas",
                             pop_type = "ASY")
#> Warning: Use of `datatree$Value` is discouraged.
#> ℹ Use `Value` instead.
#> Use of `datatree$Value` is discouraged.
#> ℹ Use `Value` instead.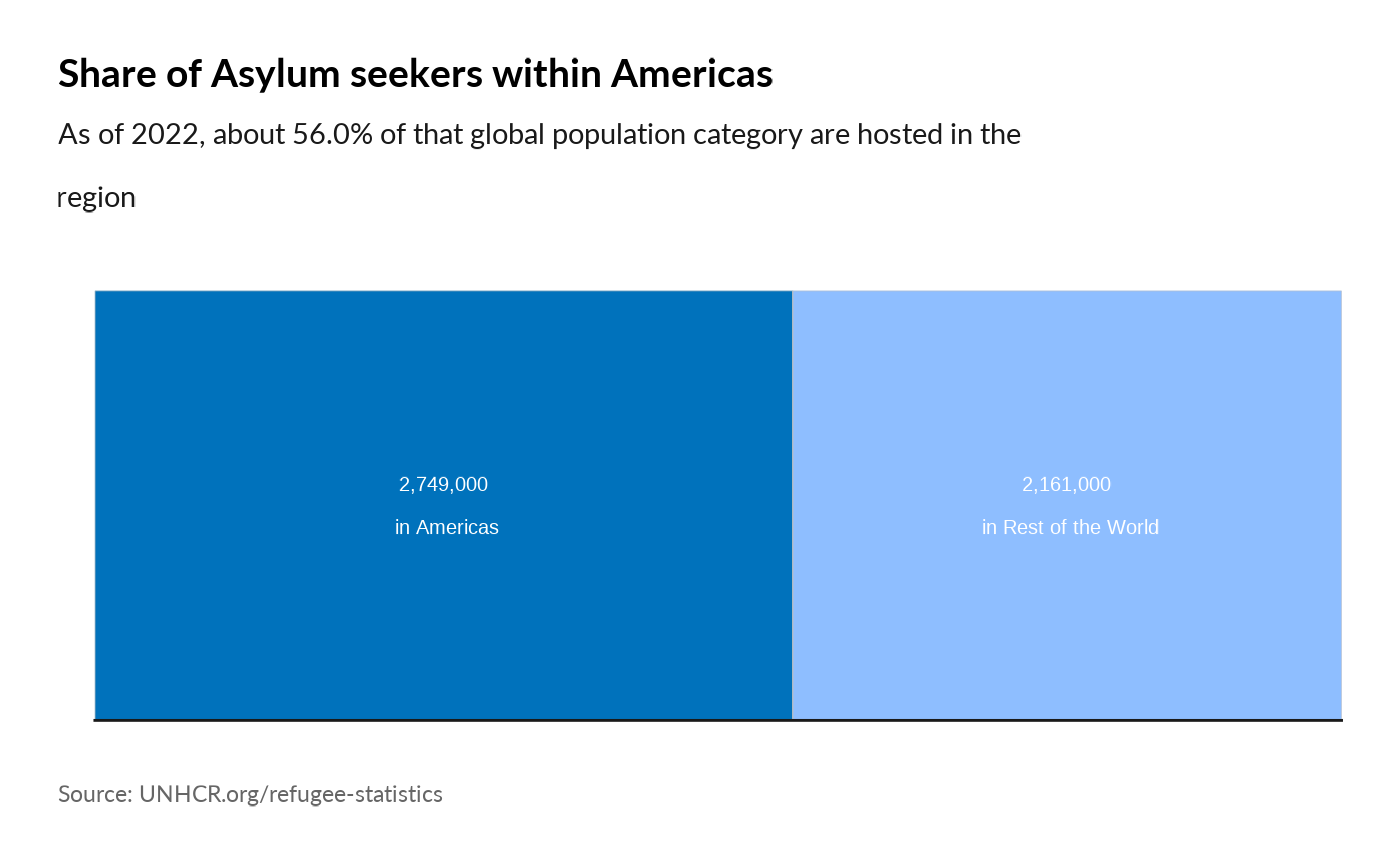
plot_reg_share(year = 2022,
                             region = "Americas",
                             pop_type = "OIP")
#> Warning: Use of `datatree$Value` is discouraged.
#> ℹ Use `Value` instead.
#> Use of `datatree$Value` is discouraged.
#> ℹ Use `Value` instead.
plot_reg_share(year = 2022,
                             region = "Americas",
                             pop_type = "IDP")
#> Warning: Use of `datatree$Value` is discouraged.
#> ℹ Use `Value` instead.
#> Use of `datatree$Value` is discouraged.
#> ℹ Use `Value` instead.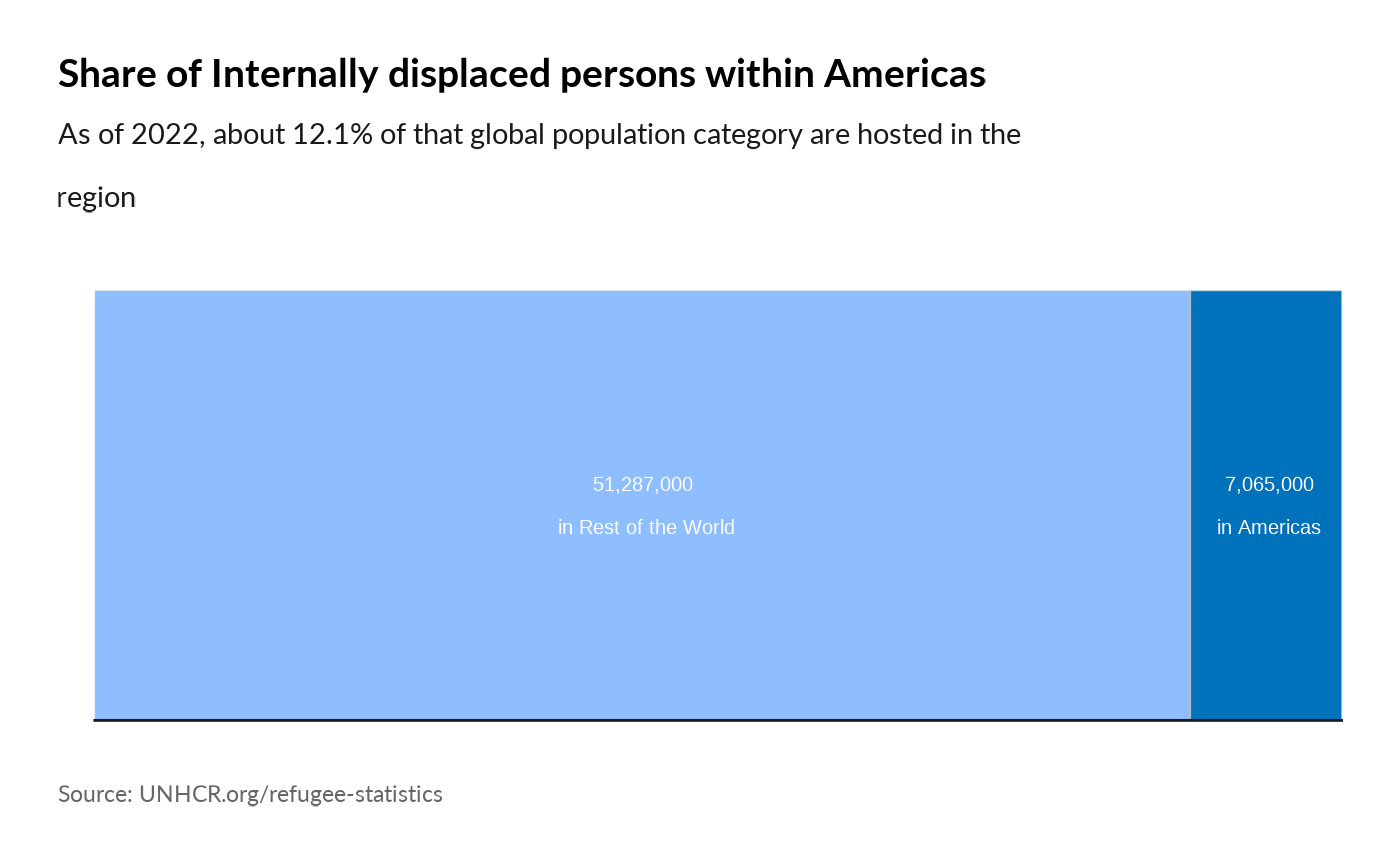
plot_reg_share(year = 2022,
                             region = "Americas",
                             pop_type = "STA")
#> Warning: Use of `datatree$Value` is discouraged.
#> ℹ Use `Value` instead.
#> Use of `datatree$Value` is discouraged.
#> ℹ Use `Value` instead.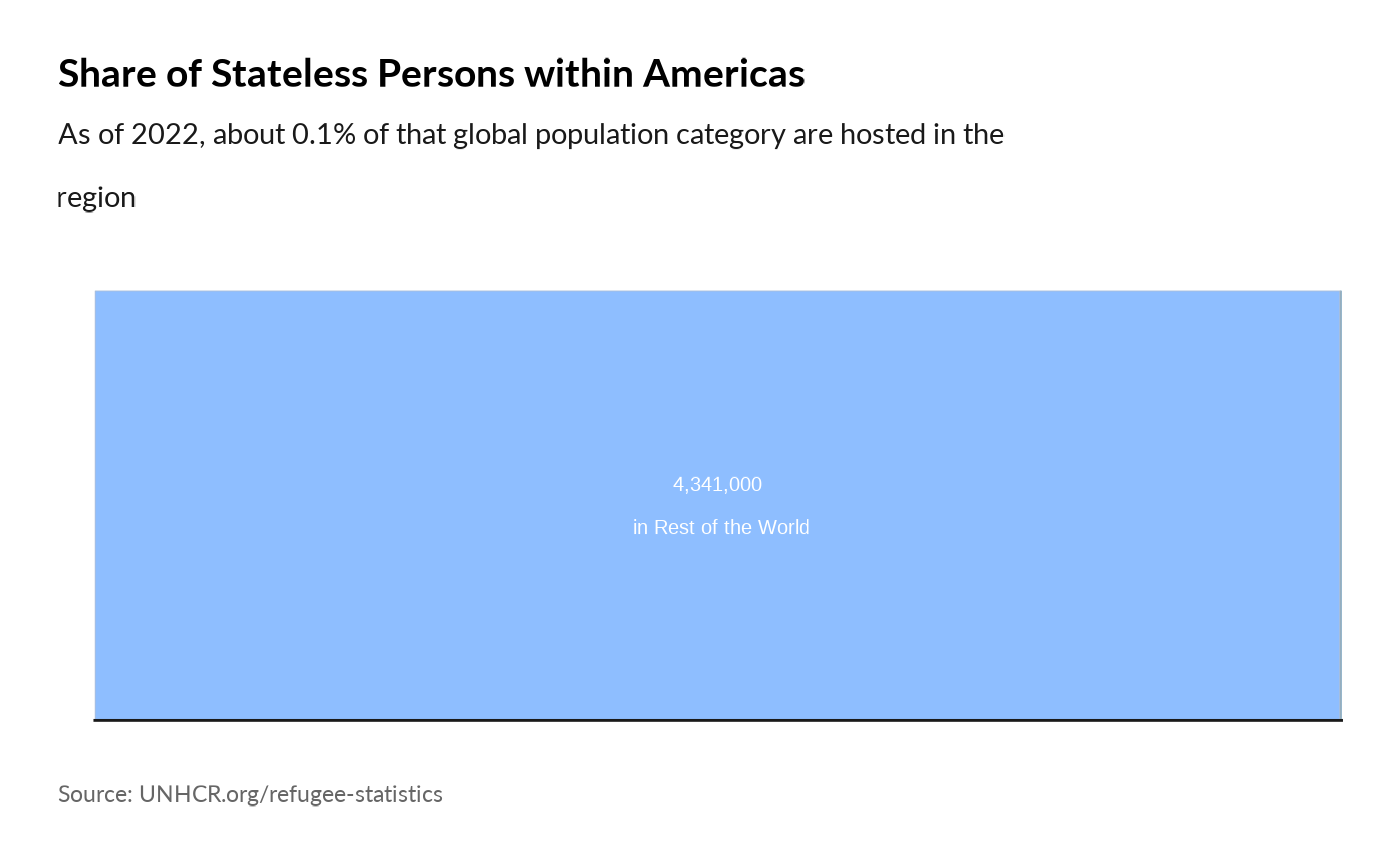
Evolution Over Time
plot_reg_evolution(year = 2021,
                   lag = 5,
                   region = "Asia",
                   pop_type =  c( "REF", "IDP", "ASY", "OOC", "STA", "OIP"))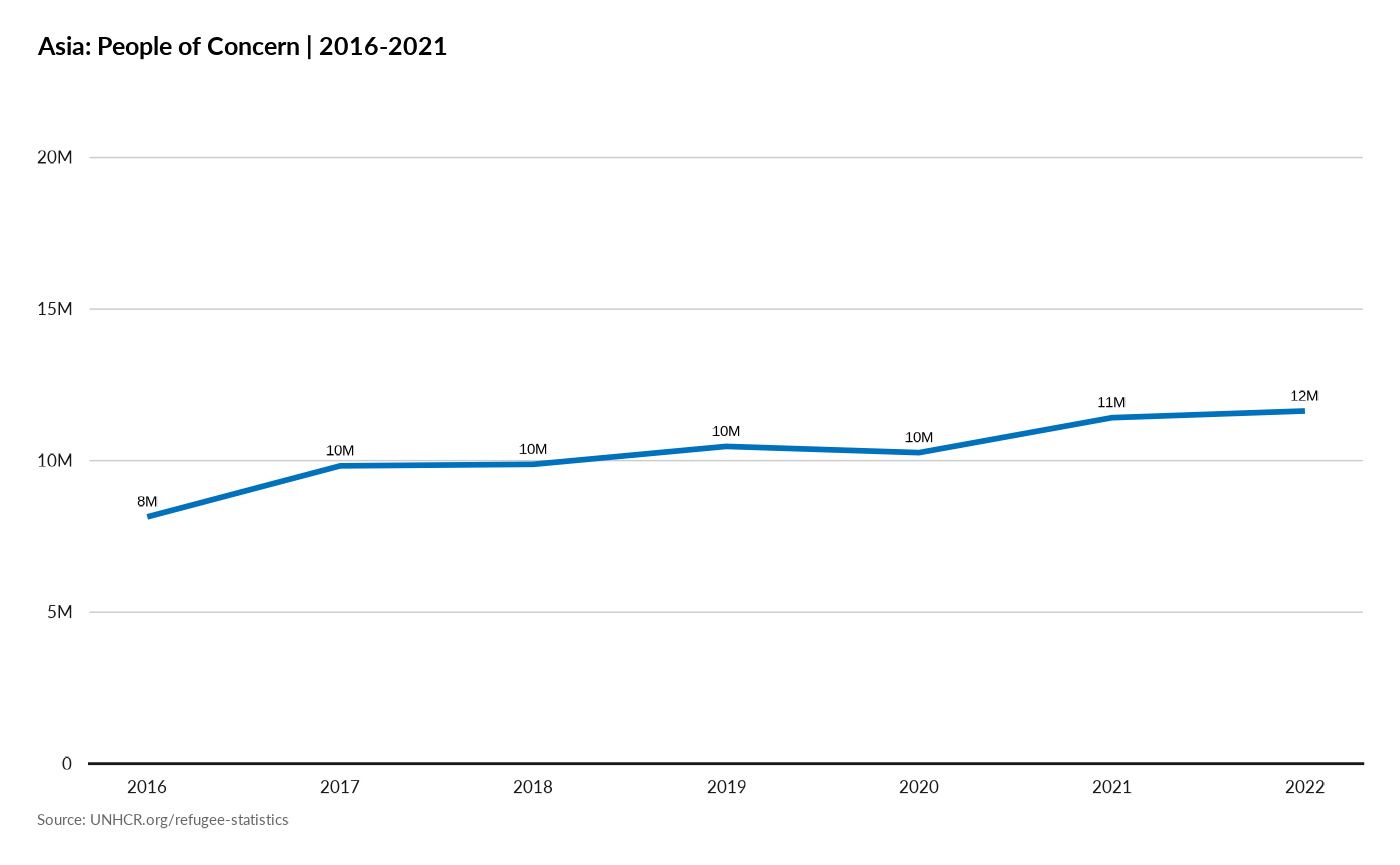
Plot Evolution of Population type per year
plot_reg_population_type_per_year(year = 2022,
                                              lag = 5,
                                     region  = "Americas",
                                     pop_type =   c("REF", "ASY", "IDP", "OIP", "STA", "OOC") )
#> Warning: The dot-dot notation (`..y..`) was deprecated in ggplot2 3.4.0.
#> ℹ Please use `after_stat(y)` instead.
#> ℹ The deprecated feature was likely used in the unhcrdatapackage package.
#>   Please report the issue at
#>   <https://github.com/edouard-legoupil/unhcrdatapackage/issues>.
#> This warning is displayed once every 8 hours.
#> Call `lifecycle::last_lifecycle_warnings()` to see where this warning was
#> generated.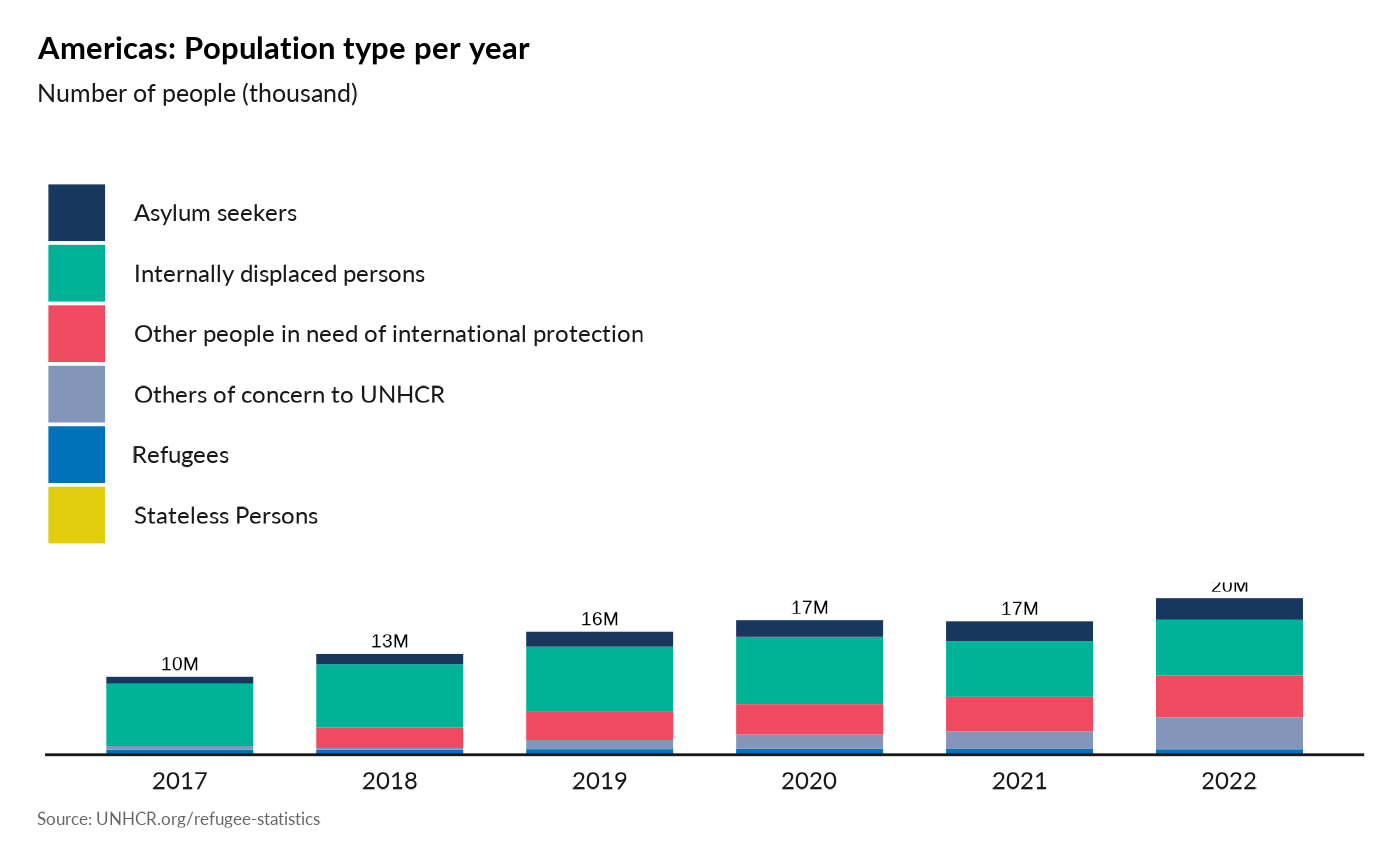
Plot Population Origin-Destination within the region
plot_reg_origin_dest(year = 2022, region = "Asia")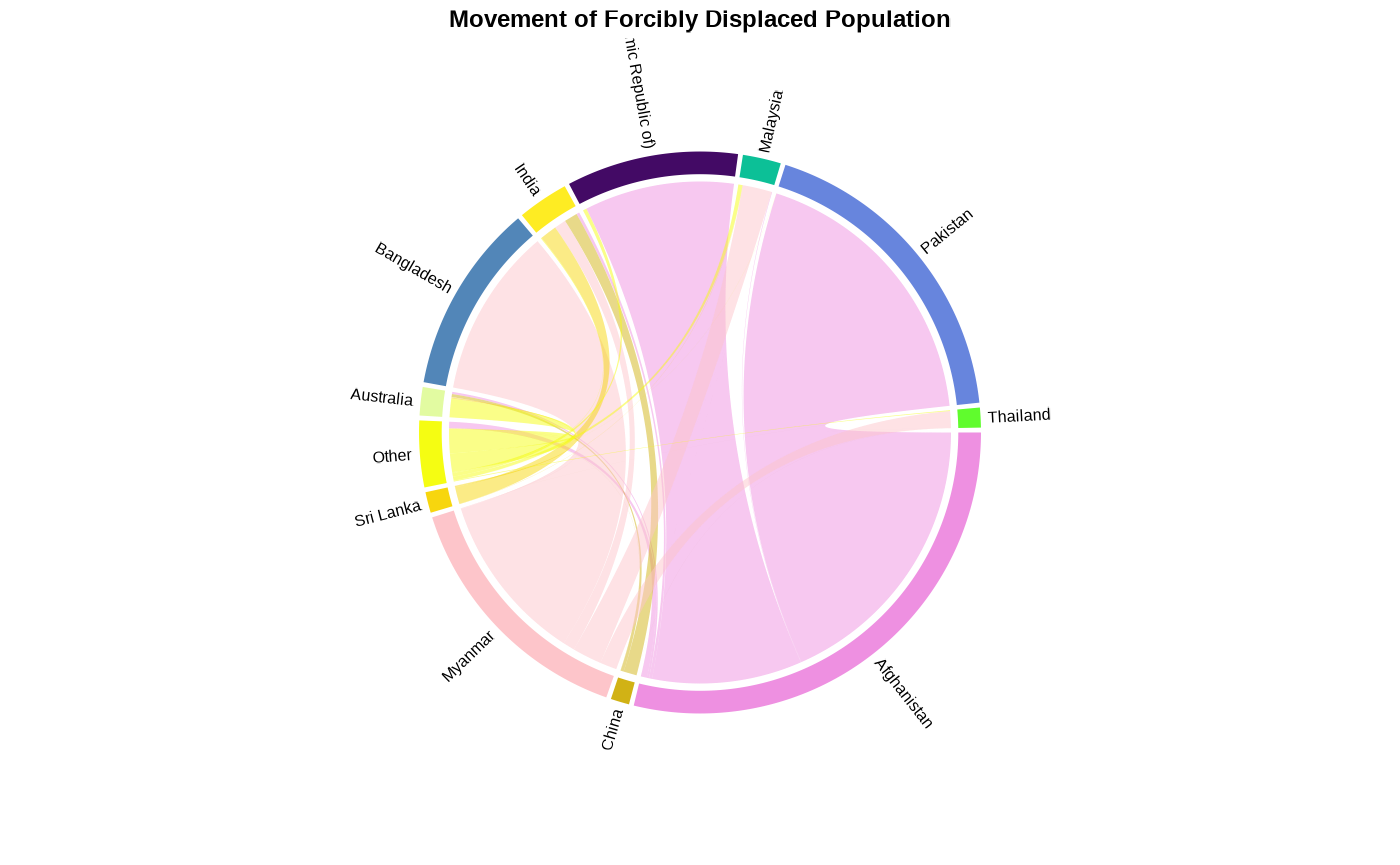
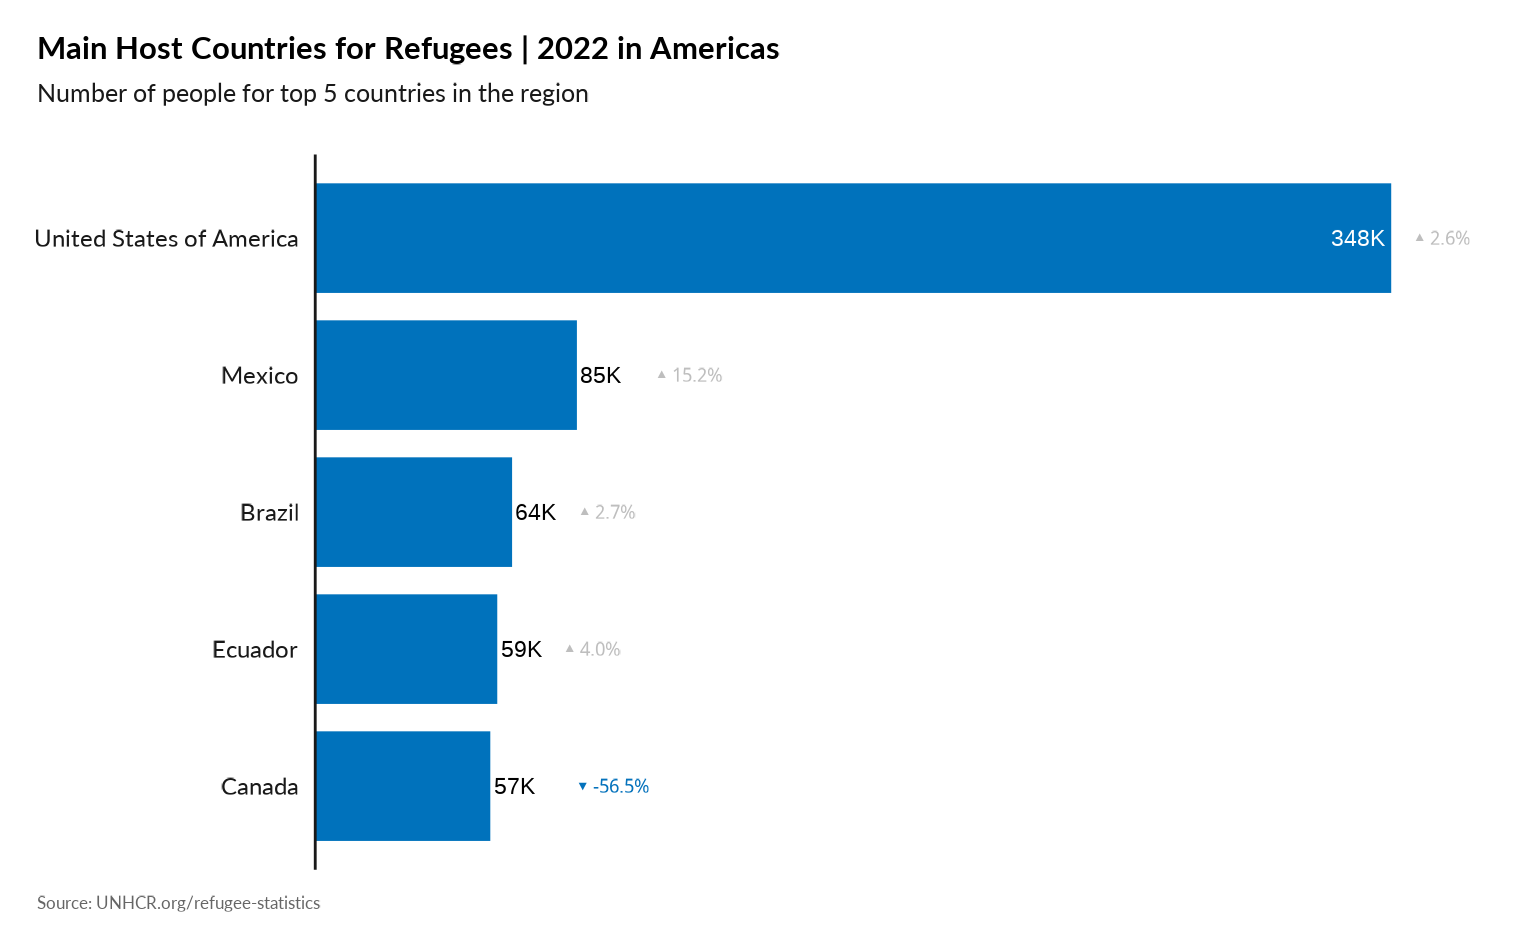
Plot Main country of Asylum in the Region
plot_reg_population_type_abs(year = 2022,
                              region = "Americas",
                              top_n_countries = 5,
                              pop_type = "REF",
                              show_diff_label = TRUE
                              )
plot_reg_population_type_abs(year = 2022,
                              region = "Americas",
                              top_n_countries = 5,
                              pop_type = "ASY",
                              show_diff_label = FALSE
                              )
Plot Biggest decrease in Refugee Population
plot_reg_decrease(year = 2021,
                  lag = 5,
                  topn = 5,
                  region = "Americas",
                  pop_type = c("REF", "ASY", "OIP"))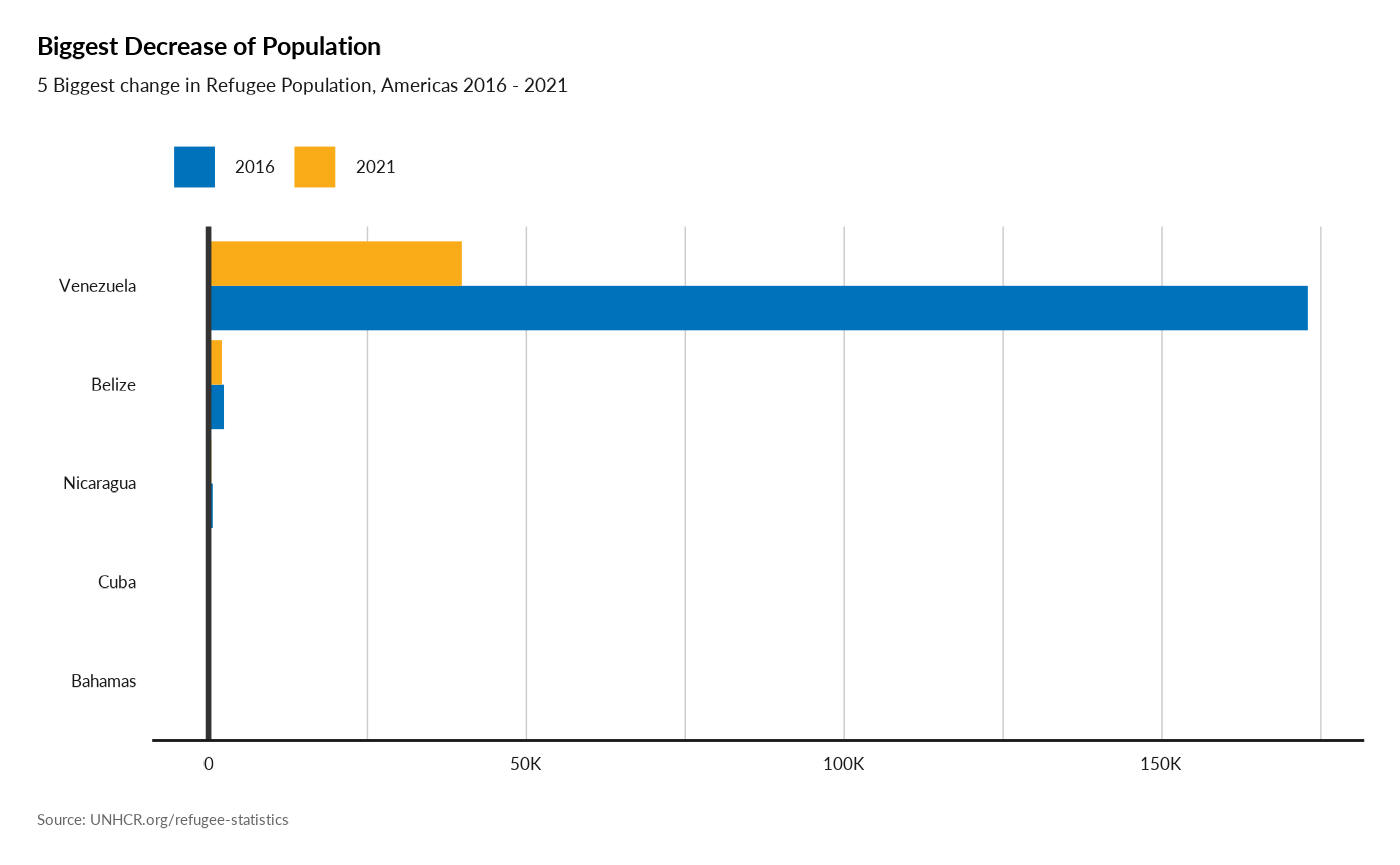
Plot Biggest increase in Refugee Population
plot_reg_increase(year = 2021,
                  lag = 5,
                  topn = 5,
                  region = "Americas",
                  pop_type = c("REF", "ASY", "OIP"))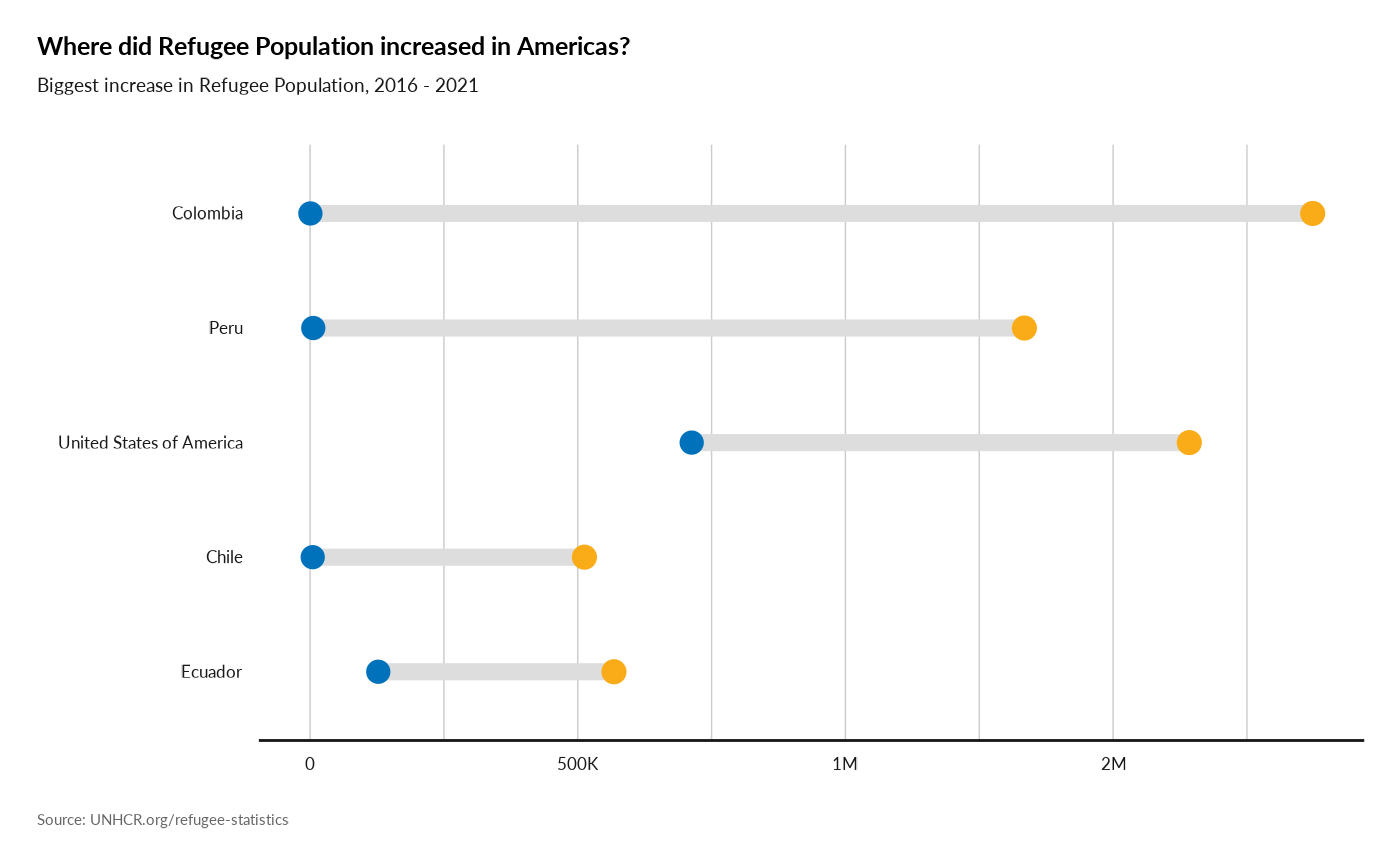
plot_reg_increase(year = 2021,
                  lag = 5,
                  topn = 5,
                  region = "Asia",
                  pop_type = c("REF", "ASY", "OIP"))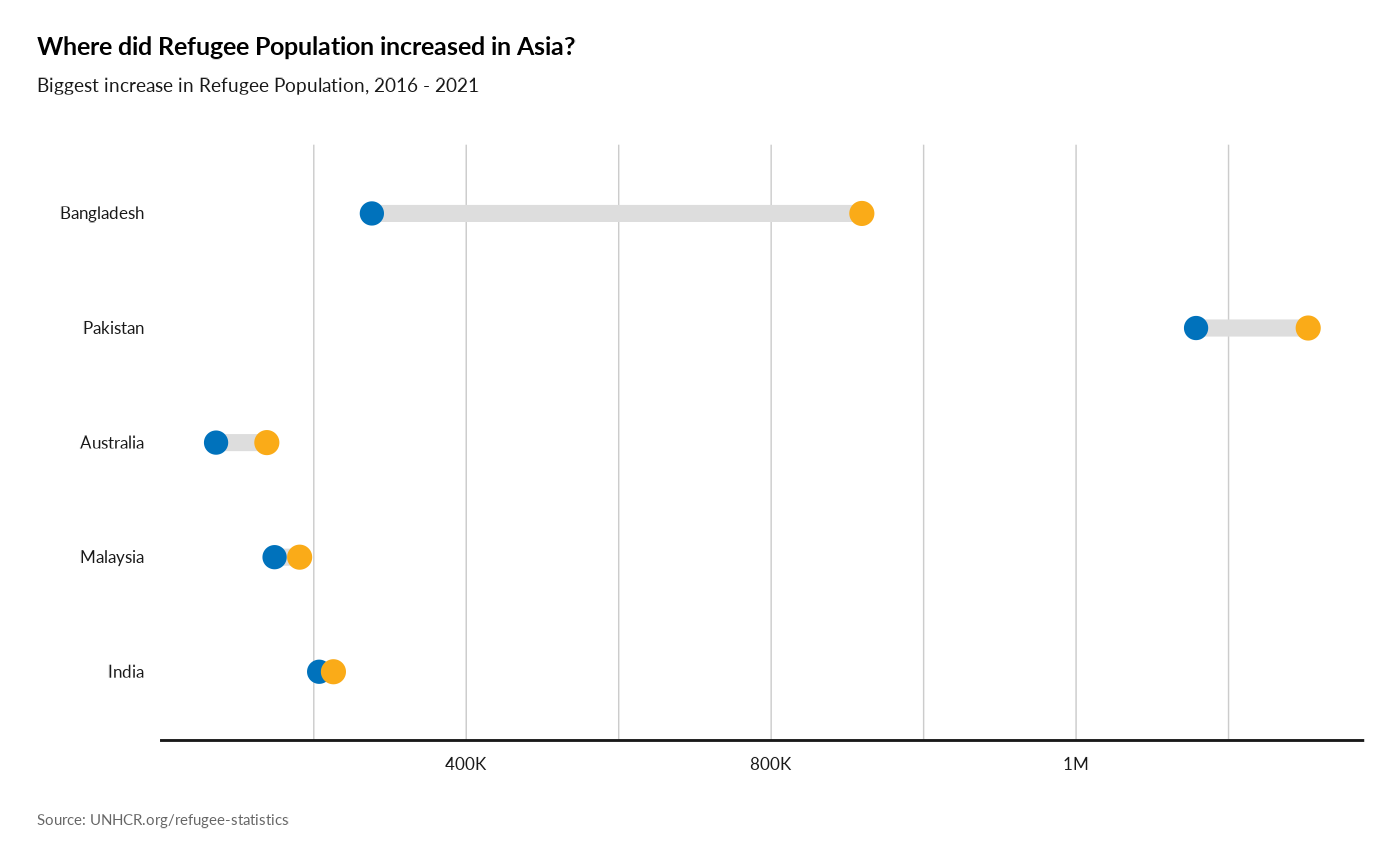
Proportion of the population who are refugees, by country of origin (SDG indicator 10.7.4 )
plot_reg_prop_origin(year = 2022, region = "Americas")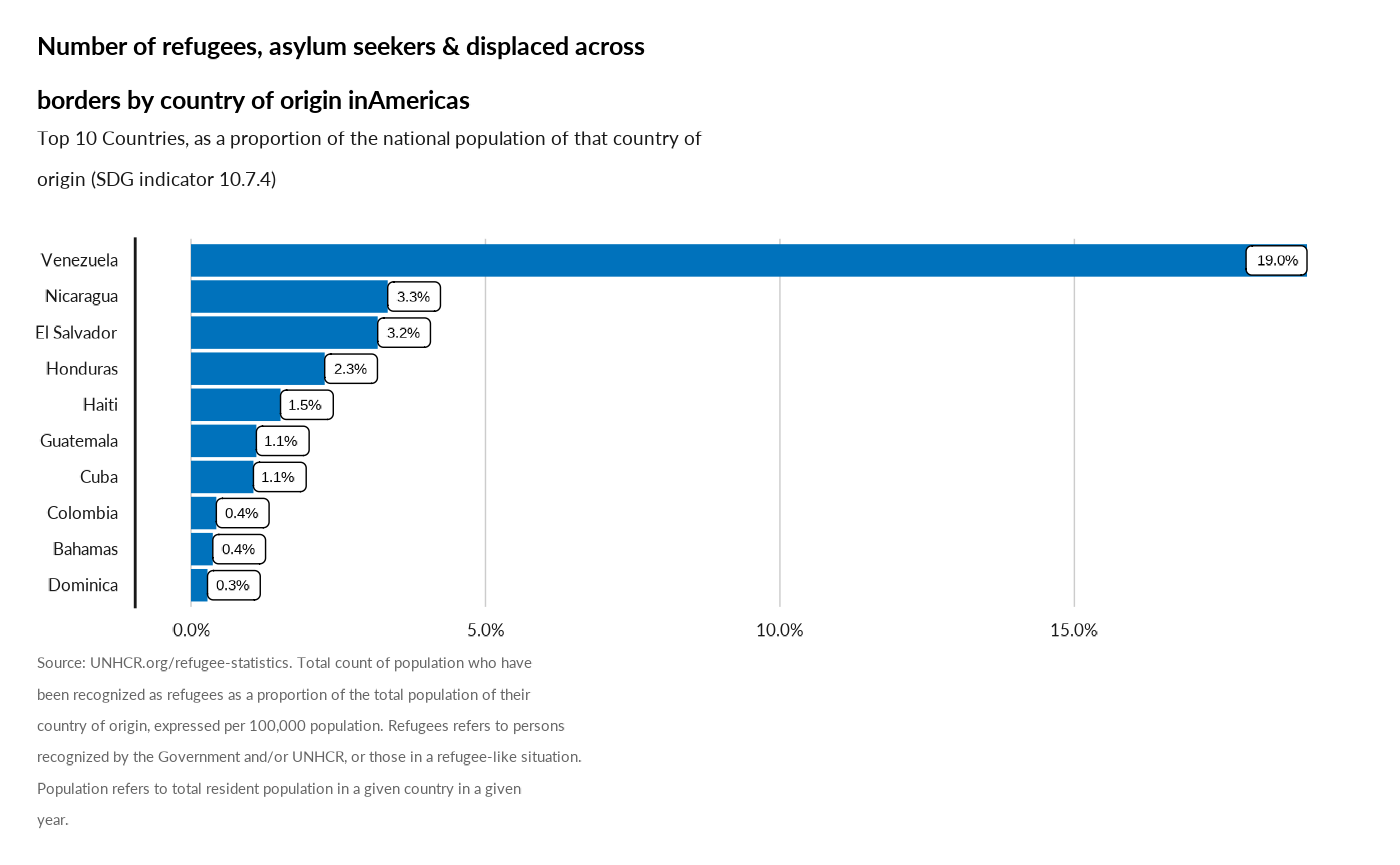
Decision on Refugee Status Determination
plot_reg_rsd(year = 2022,
             region = "Americas" ,
                        top_n_countries = 10,
                        measure = "Recognized")
#> Scale for y is already present.
#> Adding another scale for y, which will replace the existing scale.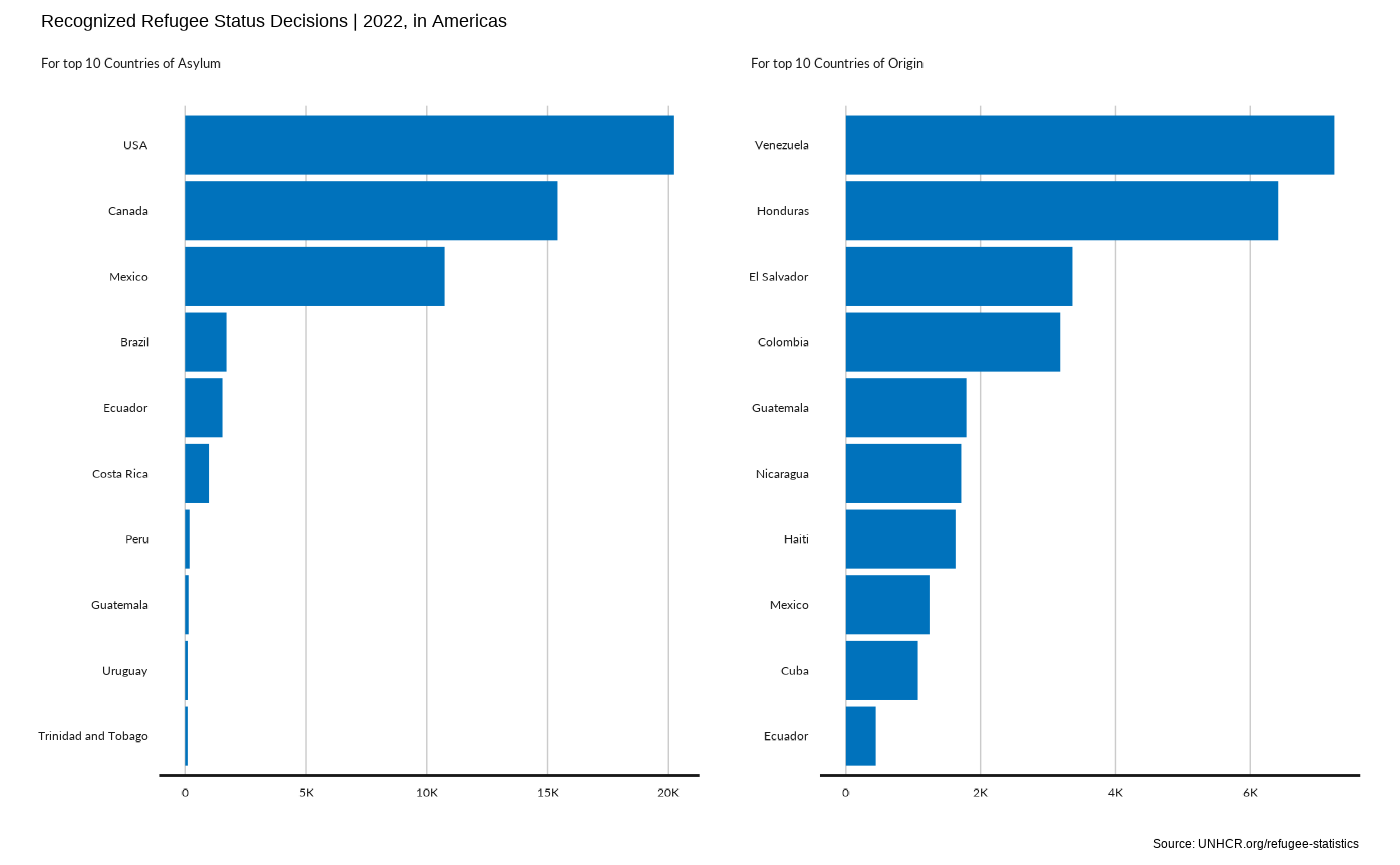
plot_reg_rsd(year = 2022,
             region = "Americas" ,
                        top_n_countries = 5,
                        measure = "ComplementaryProtection")
#> Scale for y is already present.
#> Adding another scale for y, which will replace the existing scale.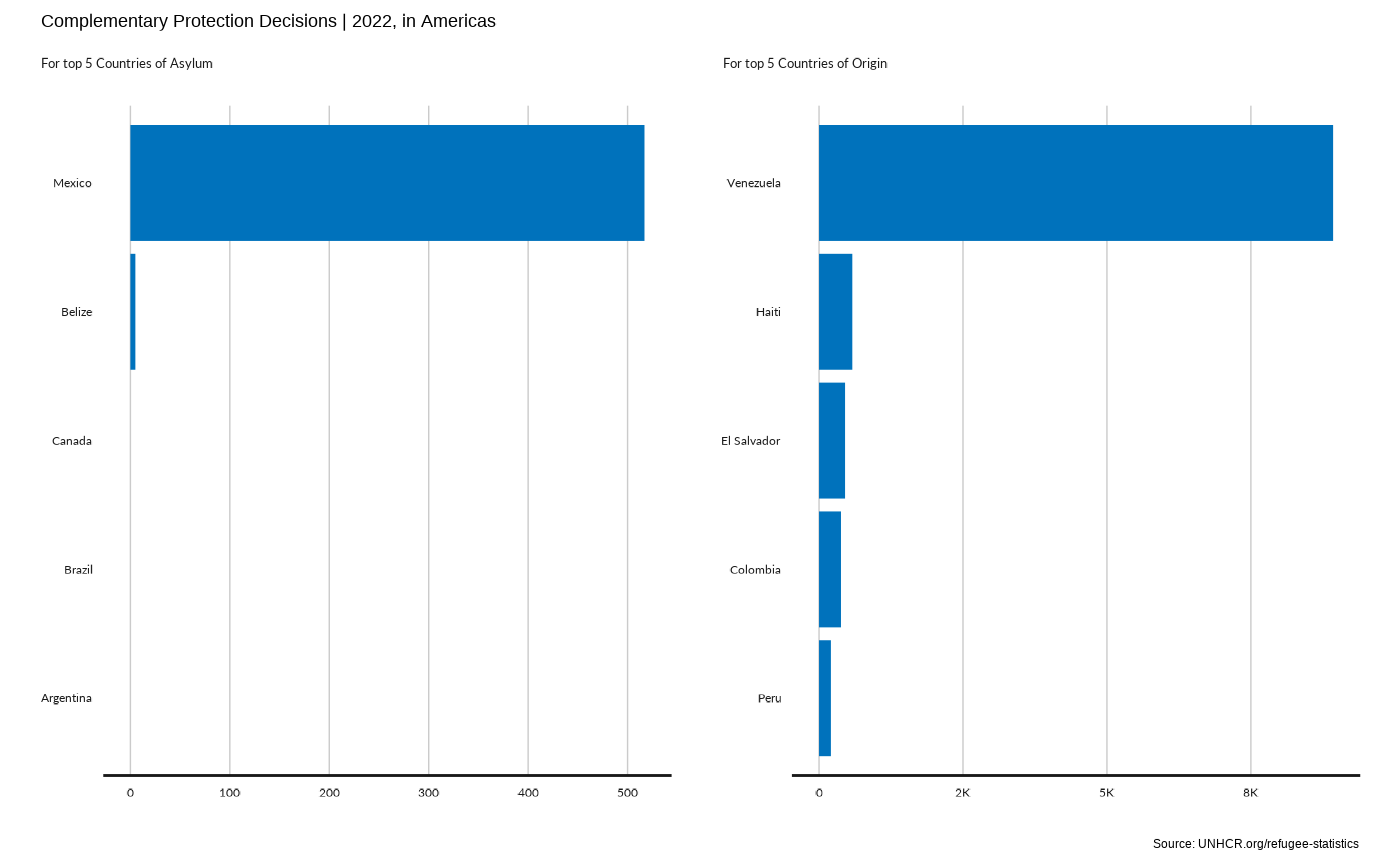
plot_reg_rsd(year = 2022,
             region = "Americas" ,
                        top_n_countries = 10,
                        measure = "TotalDecided")
#> Scale for y is already present.
#> Adding another scale for y, which will replace the existing scale.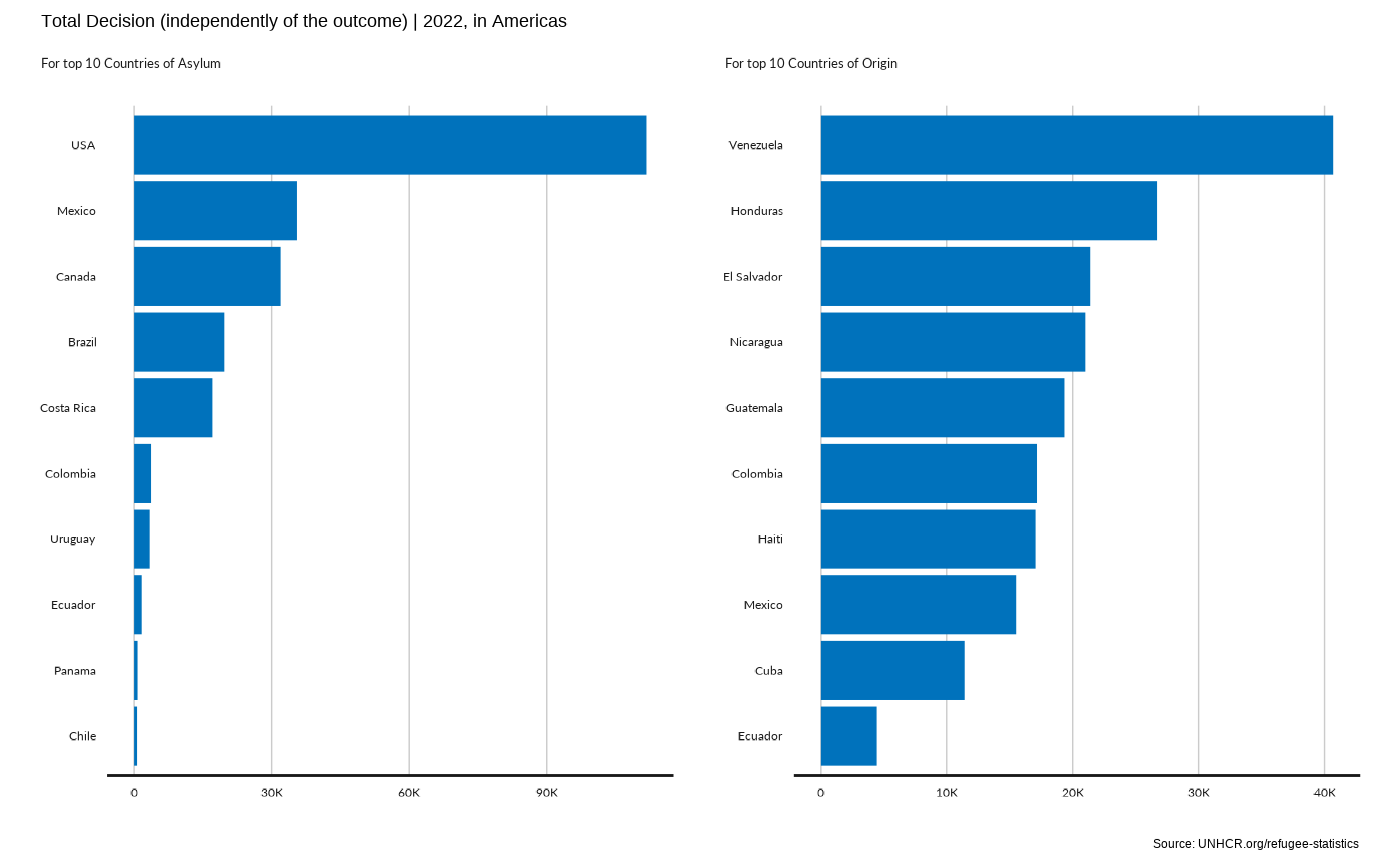
plot_reg_rsd(year = 2022,
             region = "Americas" ,
                        top_n_countries = 10,
                        measure = "RefugeeRecognitionRate")
#> Scale for y is already present.
#> Adding another scale for y, which will replace the existing scale.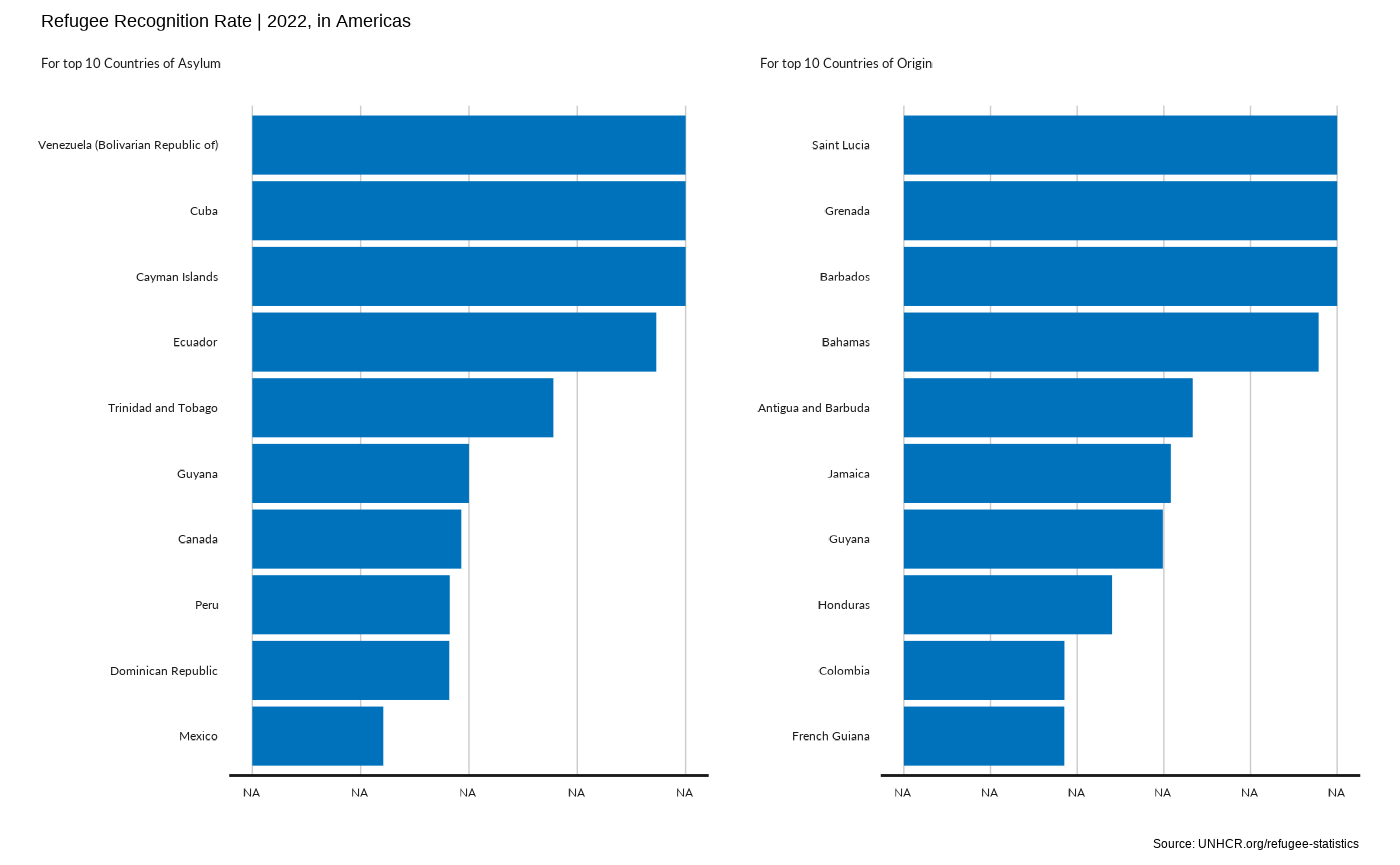
plot_reg_rsd(year = 2022,
             region = "Americas" ,
                        top_n_countries = 10,
                        measure = "TotalRecognitionRate")
#> Scale for y is already present.
#> Adding another scale for y, which will replace the existing scale.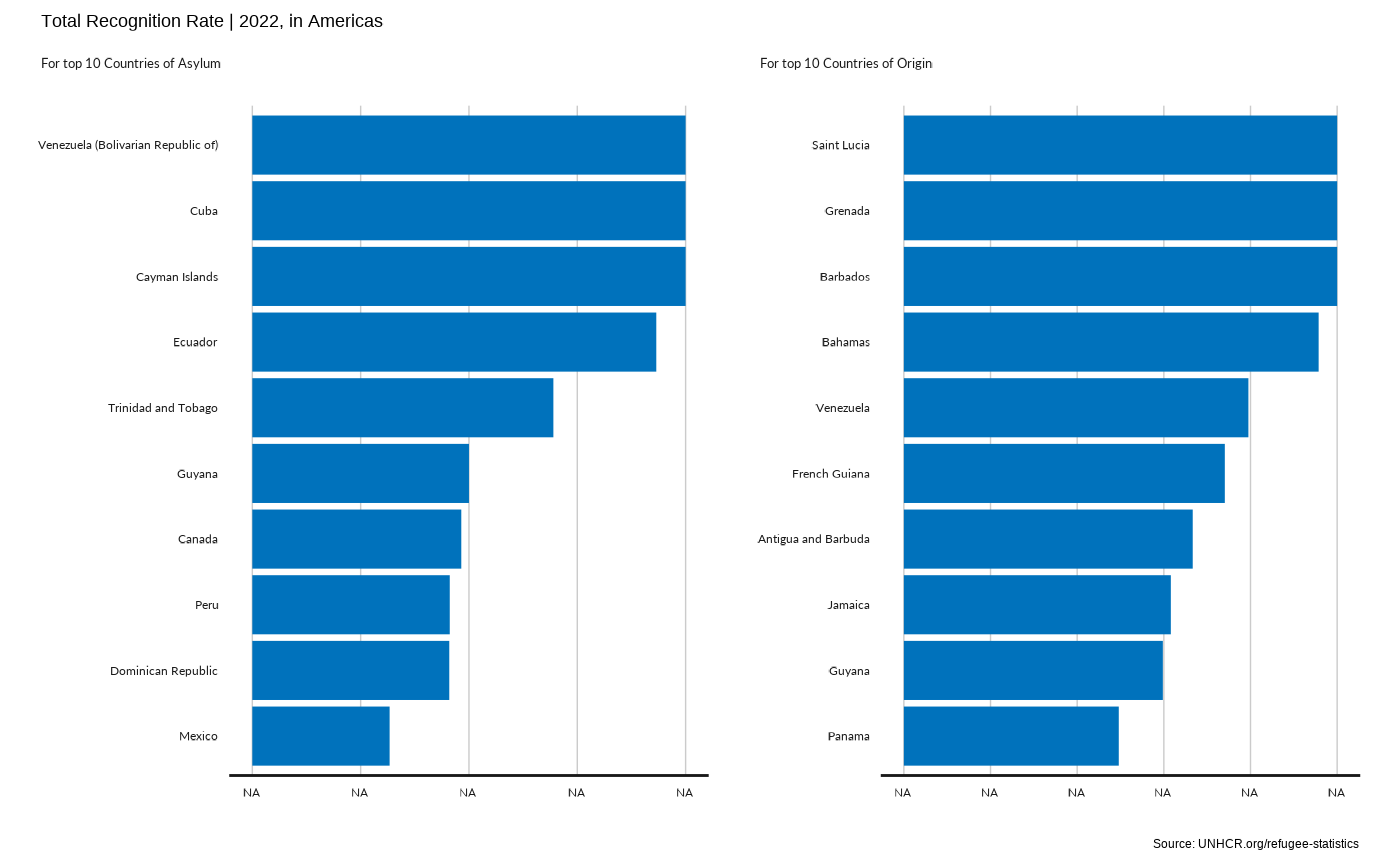
# plot_reg_rsd(year = 2022,
#              region = "Europe",
#                         top_n_countries = 10,
#                         measure = "Recognized")
Plot Evolution of Solutions in the Region
plot_reg_solution(year = 2022,
                            region = "Americas",
                            lag = 10)
#> `geom_smooth()` using formula = 'y ~ x'
#> Warning in simpleLoess(y, x, w, span, degree = degree, parametric = parametric,
#> : span too small.  fewer data values than degrees of freedom.
#> Warning in simpleLoess(y, x, w, span, degree = degree, parametric = parametric,
#> : pseudoinverse used at 2012
#> Warning in simpleLoess(y, x, w, span, degree = degree, parametric = parametric,
#> : neighborhood radius 1.05
#> Warning in simpleLoess(y, x, w, span, degree = degree, parametric = parametric,
#> : reciprocal condition number 0
#> Warning in simpleLoess(y, x, w, span, degree = degree, parametric = parametric,
#> : There are other near singularities as well. 1.1025
#> Warning in simpleLoess(y, x, w, span, degree = degree, parametric = parametric,
#> : span too small.  fewer data values than degrees of freedom.
#> Warning in simpleLoess(y, x, w, span, degree = degree, parametric = parametric,
#> : pseudoinverse used at 2012
#> Warning in simpleLoess(y, x, w, span, degree = degree, parametric = parametric,
#> : neighborhood radius 1.045
#> Warning in simpleLoess(y, x, w, span, degree = degree, parametric = parametric,
#> : reciprocal condition number 0
#> Warning in simpleLoess(y, x, w, span, degree = degree, parametric = parametric,
#> : There are other near singularities as well. 1.092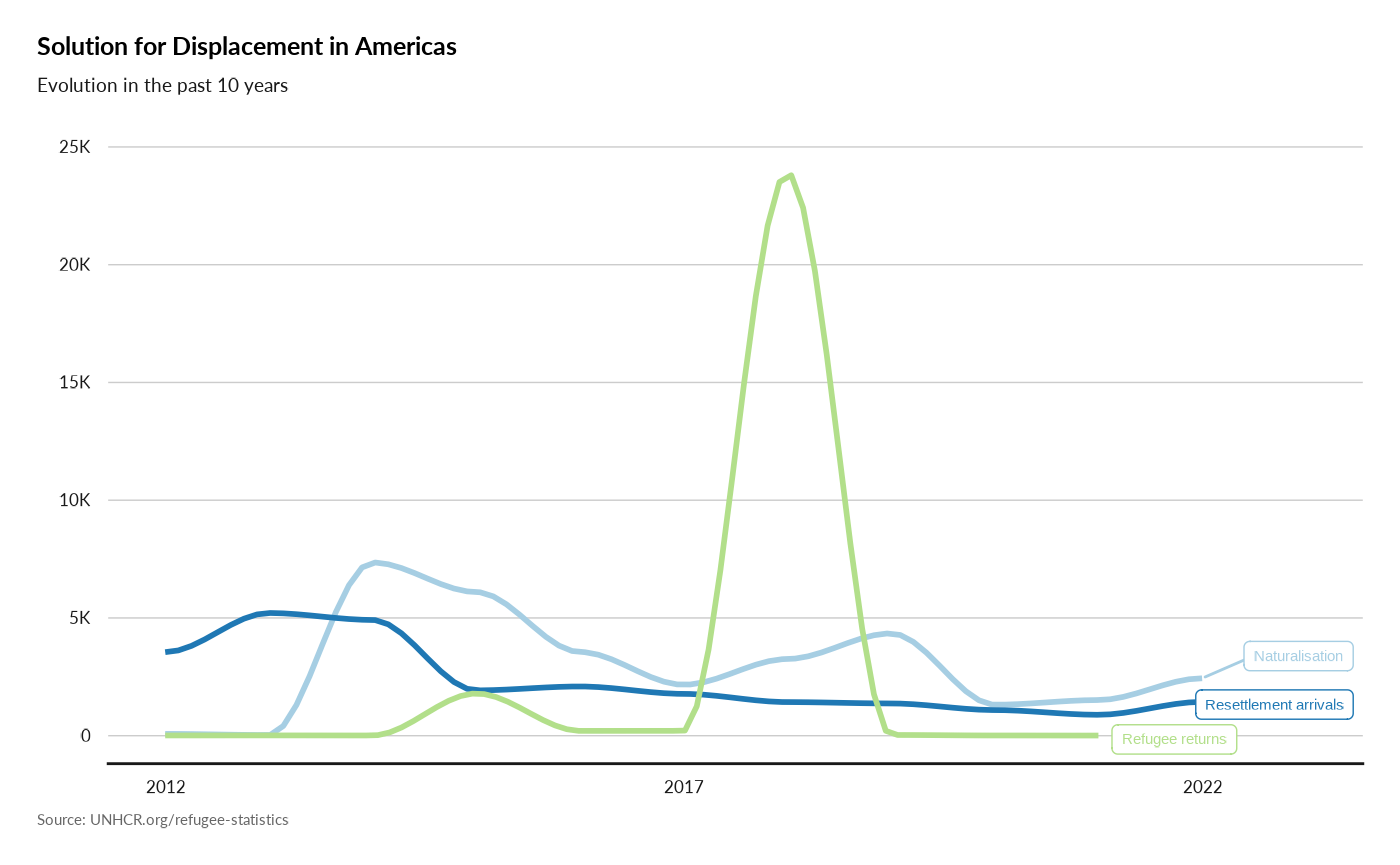
Mapping Population
plot_reg_map(  year = 2022,
                            region = "Asia",
                            topn = 5,
                            pop_type =  c("REF", "ASY", "OIP"),
                            projection = "Mercator",
                            maxSymbolsize = .25)
#> Warning in CPL_crs_from_input(x): GDAL Message 1: +init=epsg:XXXX syntax is
#> deprecated. It might return a CRS with a non-EPSG compliant axis order.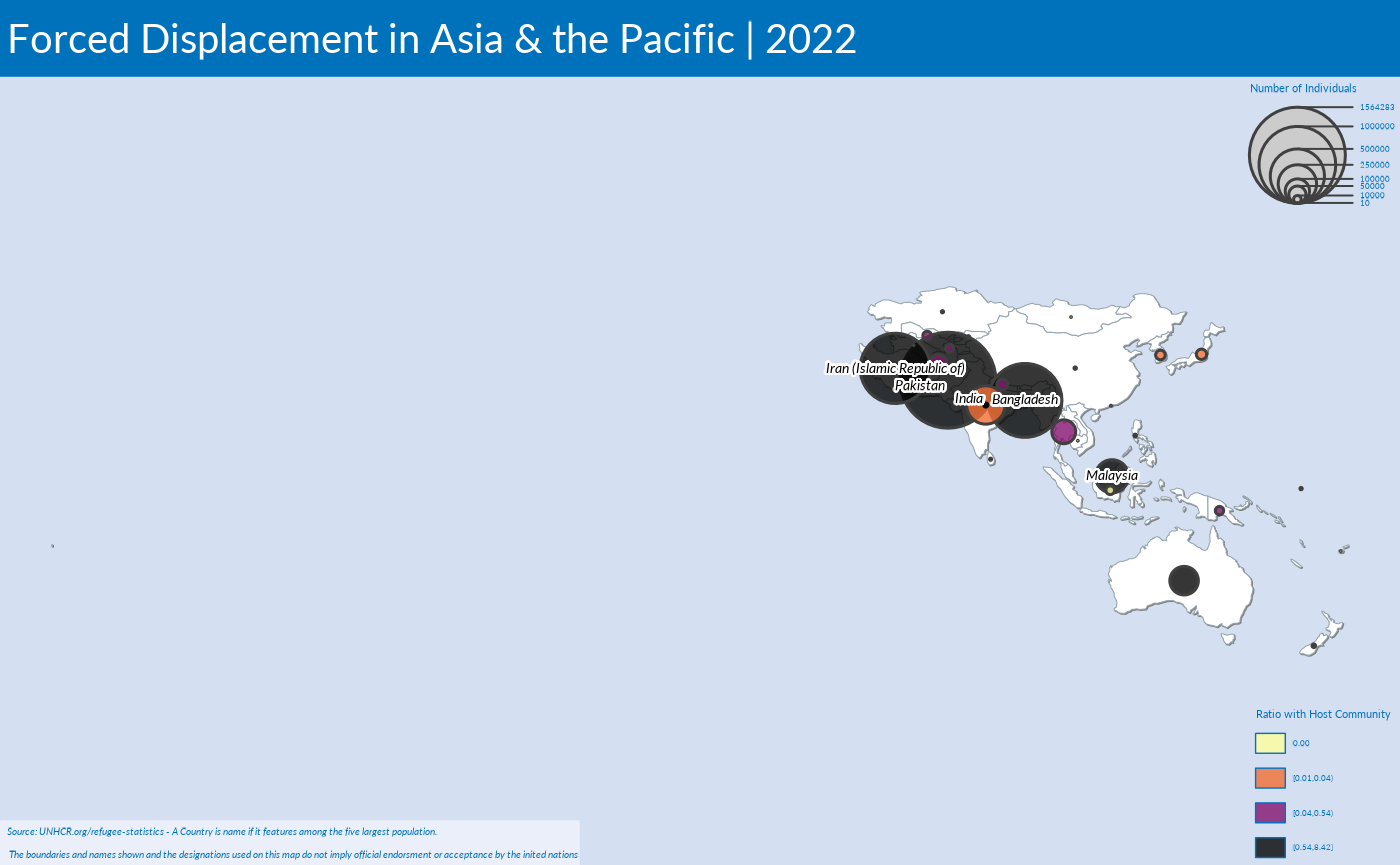
# plot_reg_map(  year = 2022,
#                             region = "WestAfrica",
#                             topn = 5,
#                             pop_type =  c("REF", "ASY", "OIP"),
#                             projection = "Mercator",
#                             maxSymbolsize = .25)
Report Templates
Templates are re-built notebook that includes all the plotting functions above and are integrated with report parameters. Templates are available both as html report (that can be converted to PDF) and as PowerPoint presentations, all defined from UNHCR standard brand (cf unhcrdown. The templates are available either for countries or regions.
Country Factsheet
## generate for one country
# template_CtryFactsheet(year = 2022, country_asylum_iso3c = "USA",   folder = "Report")

# ## Generate for a specific region
# region <- "Americas"
# year <- 2022
# library(tidyverse)
# ## get all countries with more than 1000 Reported individuals
# ctr <- dplyr::left_join( x= ForcedDisplacementStat::end_year_population_totals_long,
#                                 y= ForcedDisplacementStat::reference,
#                                 by = c("CountryAsylumCode" = "iso_3")) |>
#         filter(Year == year &
#                 UNHCRBureau == region ) |>
#         group_by( CountryAsylumName, CountryAsylumCode   ) |>
#         summarise(Value = sum(Value) ) |>
#         ungroup() |>
#         filter( Value  > 1000 )
#
# for ( i in (1:nrow(ctr))) {
#     # i <- 1
#     country_asylum_iso3ci = as.character(ctr[i ,2 ])
#     cat(paste0(country_asylum_iso3ci, "\n"))
#     unhcrdatapackage::template_CtryFactsheet(year = 2022,
#               country_asylum_iso3c = country_asylum_iso3ci,
#                folder = "Report")  }
Country Presentation
## generate for one country
# unhcrdatapackage::template_CtryPrez(year = 2022,
#                             country_asylum_iso3c = "CHL",
#                             folder = "Report")

# ## Generate for a specific region
# region <- "Americas"
# year <- 2022
# library(tidyverse)
# ## get all countries with more than 1000 Reported individuals
# ctr <- dplyr::left_join( x= ForcedDisplacementStat::end_year_population_totals_long,
#                                 y= ForcedDisplacementStat::reference,
#                                 by = c("CountryAsylumCode" = "iso_3")) |>
#         filter(Year == year &
#                 UNHCRBureau == region ) |>
#         group_by( CountryAsylumName, CountryAsylumCode   ) |>
#         summarise(Value = sum(Value) ) |>
#         ungroup() |>
#         filter( Value  > 1000 )
#
# for ( i in (1:nrow(ctr))) {
#     # i <- 1
#     country_asylum_iso3ci = as.character(ctr[i ,2 ])
#     cat(paste0(country_asylum_iso3ci, "\n"))
#     unhcrdatapackage::template_CtryFactsheet(year = 2022,
#                                 country_asylum_iso3c = country_asylum_iso3ci,
#                                folder = "Report")  }
Country Slides
## generate for one country
# unhcrdatapackage::template_Ctryslides(year = 2022,
#                             country_asylum_iso3c = "CHL",
#                             folder = "Report")

# ## Generate for a specific region
# region <- "Americas"
# year <- 2022
# library(tidyverse)
# ## get all countries with more than 1000 Reported individuals
# ctr <- dplyr::left_join( x= ForcedDisplacementStat::end_year_population_totals_long,
#                                 y= ForcedDisplacementStat::reference,
#                                 by = c("CountryAsylumCode" = "iso_3")) |>
#         filter(Year == year &
#                 UNHCRBureau == region ) |>
#         group_by( CountryAsylumName, CountryAsylumCode   ) |>
#         summarise(Value = sum(Value) ) |>
#         ungroup() |>
#         filter( Value  > 1000 )
#
# for ( i in (1:nrow(ctr))) {
#     # i <- 1
#     country_asylum_iso3ci = as.character(ctr[i ,2 ])
#     cat(paste0(country_asylum_iso3ci, "\n"))
#     unhcrdatapackage::template_CtryFactsheet(year = 2022,
#                                 country_asylum_iso3c = country_asylum_iso3ci,
#                                folder = "docs/factsheet")  }
Regional Factsheet
# template_RegFactsheet(year = 2022,
#                       region = "Europe", lag = 10,
#                       folder = "Report")

## We can also generate all factsheets in a loop for 2022

# region <-  ForcedDisplacementStat::reference |>
#   dplyr::distinct(UNHCRBureau) |>
#   dplyr::filter(!(is.na(UNHCRBureau))) |>
#   dplyr::pull()
#
# for( reg in region) {
#   unhcrdatapackage::template_RegFactsheet(year = 2022,
#                         region = reg, lag = 10,
#                         folder = "Report")
# }
Regional Presentation
# template_RegPrez(year = 2022, region = "Americas", lag = 10,   folder = "Report")

# # Generate for a specific region
# region <- "Americas"
# year <- 2022
# library(tidyverse)
# ## get all countries with more than 1000 Reported individuals
# ctr <- dplyr::left_join( x= ForcedDisplacementStat::end_year_population_totals_long,
#                                 y= ForcedDisplacementStat::reference,
#                                 by = c("CountryAsylumCode" = "iso_3")) |>
#         filter(Year == year &
#                 UNHCRBureau == region ) |>
#         group_by( CountryAsylumName, CountryAsylumCode   ) |>
#         summarise(Value = sum(Value) ) |>
#         ungroup() |>
#         filter( Value  > 1000 )
#
#   for ( i in (1:nrow(ctr))) {
#     # i <- 1
#     country_asylum_iso3c = as.character(ctr[i ,2 ])
#     cat(paste0(country_asylum_iso3c, "\n"))
#     unhcrdatapackage::template_CtryPrez(year = 2022,
#                                   country_asylum_iso3c = country_asylum_iso3c,
#                                   folder = "Report")
#   }