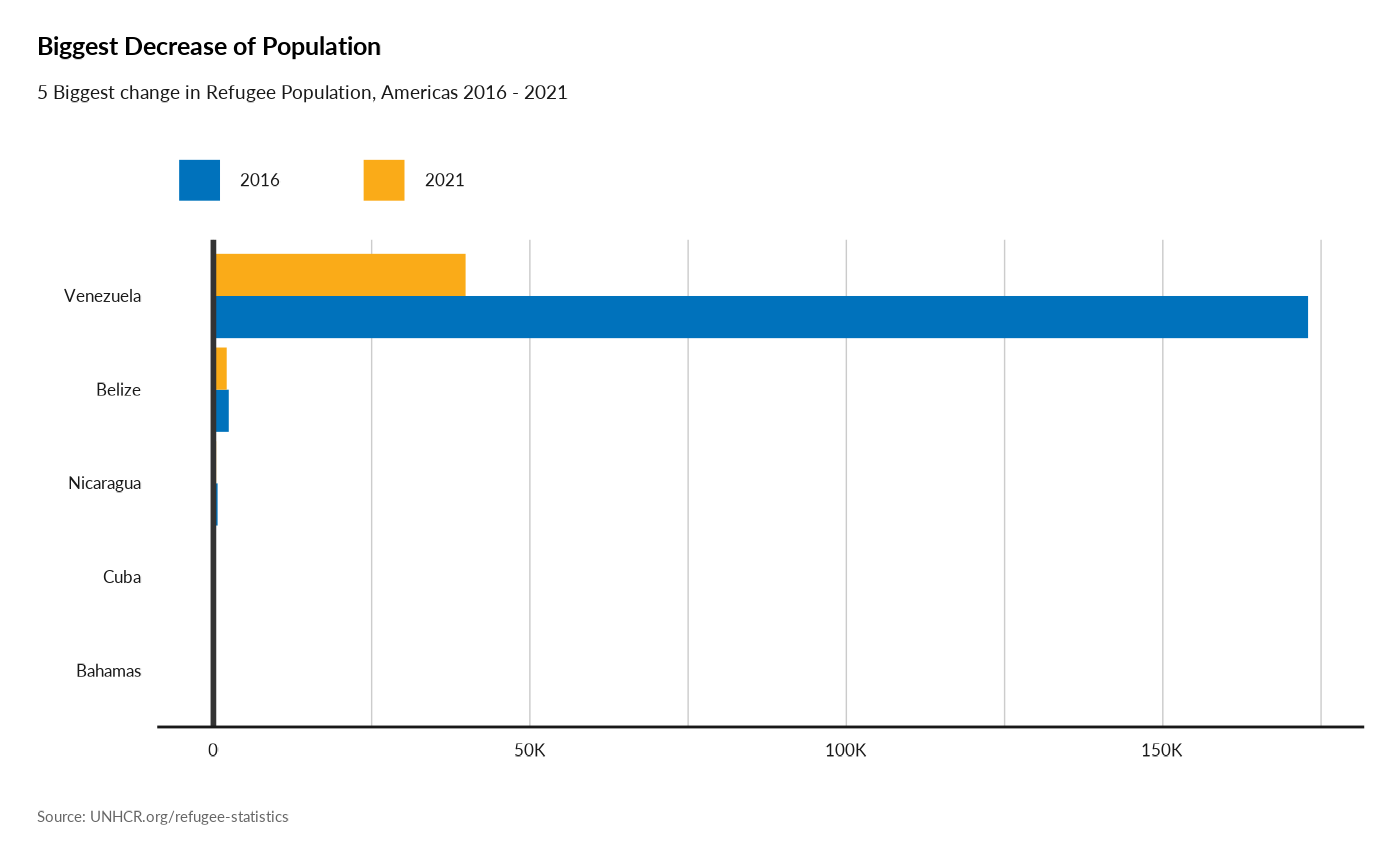
Plot Biggest decrease in Refugee Population
Usage
plot_reg_decrease(
  year = 2021,
  lag = 5,
  topn = 5,
  region = "Americas",
  pop_type = c("REF", "ASY", "OIP")
)
Arguments
- year
Numeric value of the year (for instance 2020)
- lag
Number of year to used as comparison base
- topn
how many top countries to show..
- region
Character value with the related UNHCR bureau - when left null, it will display the whole world
- pop_type
Vector of character values. Possible population type (e.g.: REF, IDP, ASY, OIP, OOC, STA)
Examples
plot_reg_decrease(year = 2021,
                  lag = 5,
                  topn = 5,
                  region = "Americas",
                  pop_type = c("REF", "ASY", "OIP"))