Description
Arguments
- year
Numeric value of the year (for instance 2020)
- region
Character value with the related UNHCR bureau - when left null, it will display the whole world
- lag
Number of year to used as comparison base
Examples
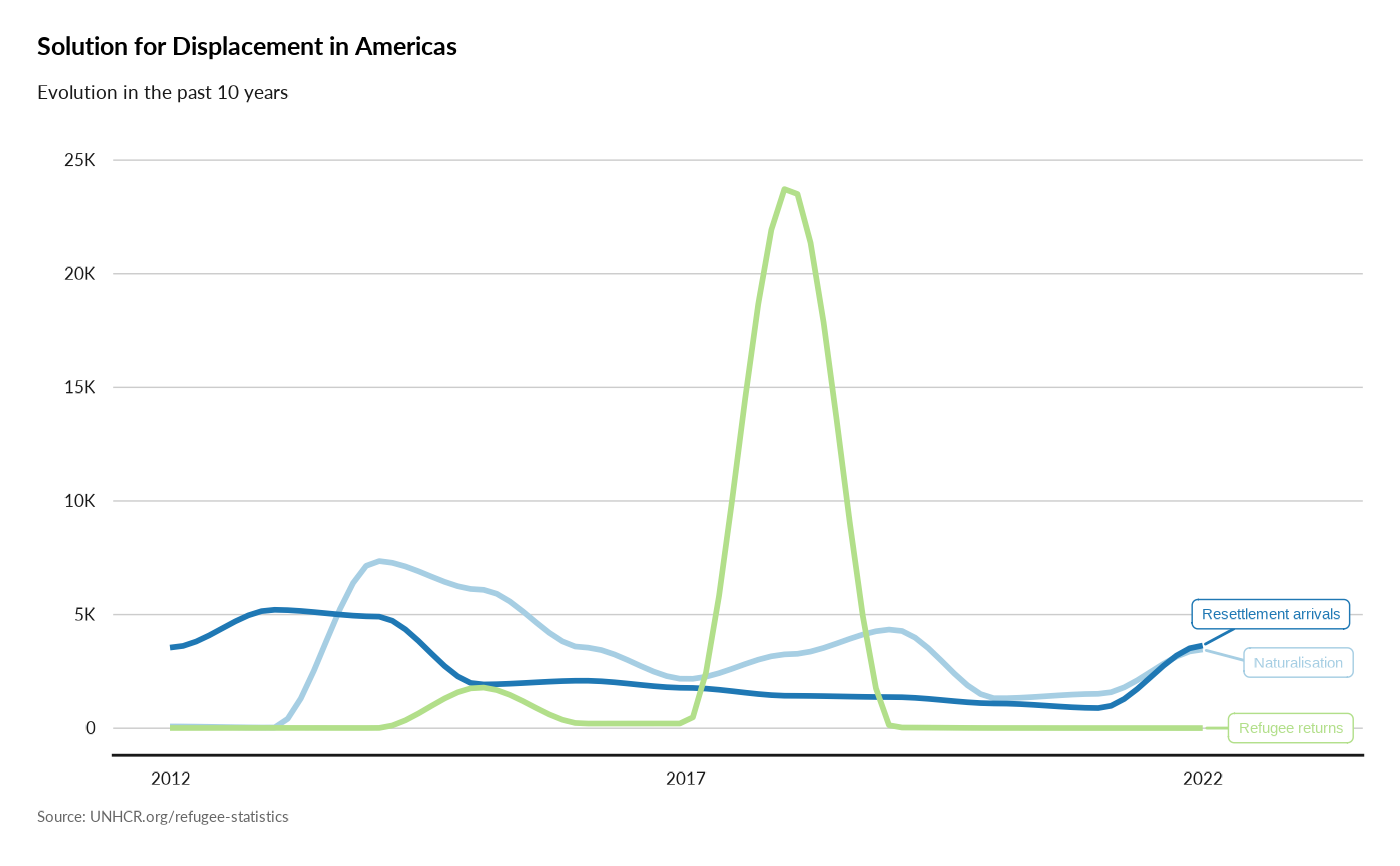
plot_reg_solution(year = 2022,
                            region = "Americas",
                            lag = 10)
#> `geom_smooth()` using formula = 'y ~ x'
#> Warning: span too small.   fewer data values than degrees of freedom.
#> Warning: pseudoinverse used at 2012
#> Warning: neighborhood radius 1.05
#> Warning: reciprocal condition number  0
#> Warning: There are other near singularities as well. 1.1025
#> Warning: span too small.   fewer data values than degrees of freedom.
#> Warning: pseudoinverse used at 2012
#> Warning: neighborhood radius 1.05
#> Warning: reciprocal condition number  0
#> Warning: There are other near singularities as well. 1.1025
#> Warning: span too small.   fewer data values than degrees of freedom.
#> Warning: pseudoinverse used at 2012
#> Warning: neighborhood radius 1.05
#> Warning: reciprocal condition number  0
#> Warning: There are other near singularities as well. 1.1025