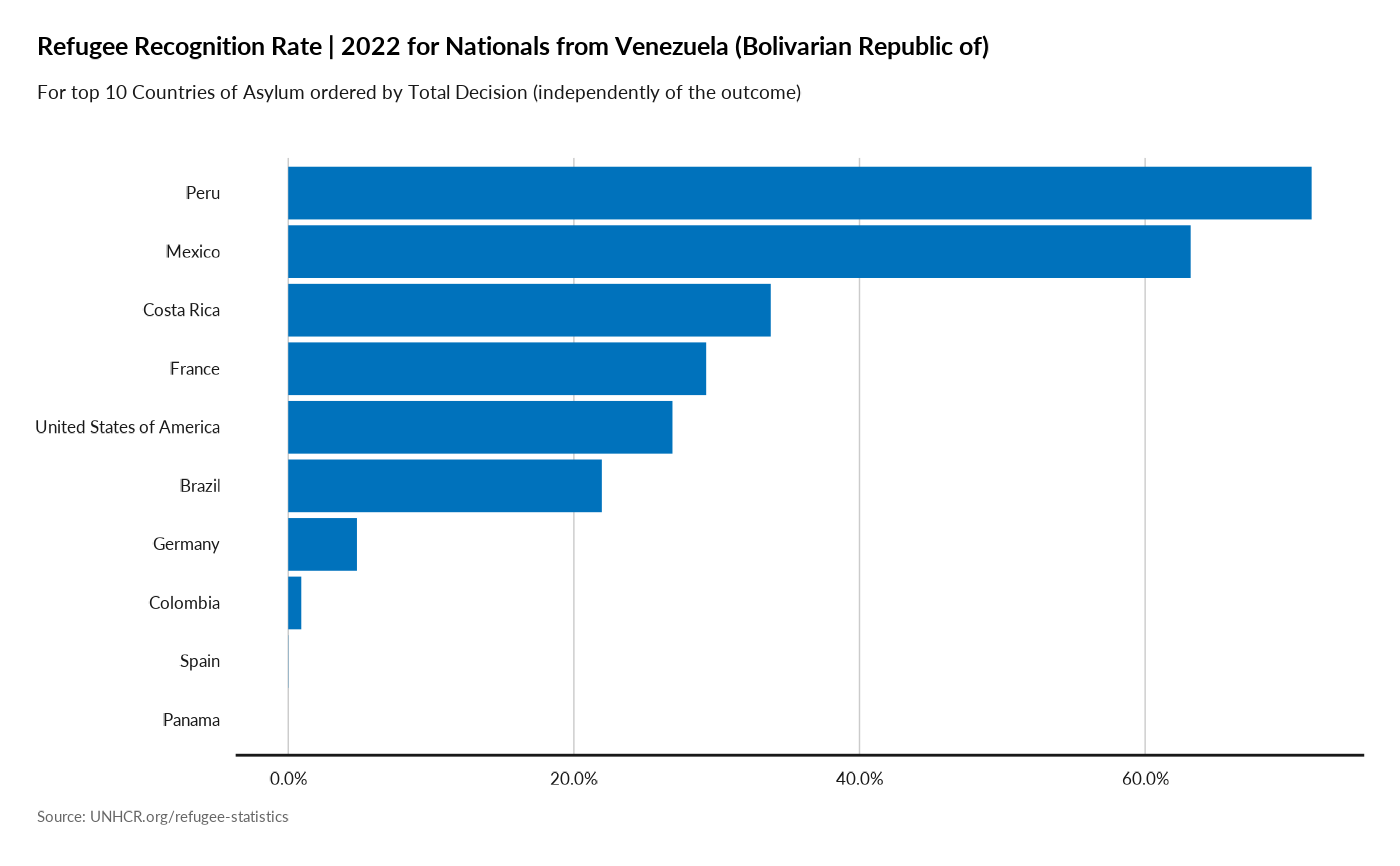
Display A Chart with Refugee Recognition Rate for nationals from a specific country
Source:R/plot_ctr_origin_recognition.R
plot_ctr_origin_recognition.RdIn the absence of an internationally agreed methodology for calculating recognition rates, UNHCR uses two rates to compute the proportion of refugee claims accepted during the year:
* The Refugee Recognition Rate divides the number of asylum-seekers granted Convention refugee status by the total number of accepted (Convention and, where relevant, complementary protection) and rejected cases (aka substantive decision).
* The Total Recognition Rate divides the number of asylum-seekers granted Convention refugee status and / or complementary form of protection by the total number of accepted (Convention and, where relevant, complementary protection) and rejected cases.
Non-substantive decisions are, to the extent possible, excluded from both calculations. For the purpose of international comparability, UNHCR only uses these two recognition rates and does not report nationally calculated rates.
See https://www.unhcr.org/4ce531e09.pdf
Usage
plot_ctr_origin_recognition(
  year = 2022,
  country_origin_iso3c,
  top_n_countries = 10,
  measure = "RefugeeRecognitionRate",
  order_by = "TotalDecided"
)
Arguments
- year
Numeric value of the year (for instance 2020)
- country_origin_iso3c
Character value with the ISO-3 character code of the Country of Origin
- top_n_countries
Numeric value of number of main countries that the graph should display
- measure
this can be either: * RefugeeRecognitionRate * TotalRecognitionRate
- order_by
this can be either: * Recognized * ComplementaryProtection * TotalDecided