Increases and Decreases in Population Groups
Source:R/plot_ctr_diff_in_pop_groups.R
plot_ctr_diff_in_pop_groups.RdIncreases and Decreases in Population Groups
Usage
plot_ctr_diff_in_pop_groups(
  year = 2021,
  country_asylum_iso3c = country_asylum_iso3c,
  pop_type = pop_type
)
Arguments
- year
Numeric value of the year (for instance 2020)
- country_asylum_iso3c
Character value with the ISO-3 character code of the Country of Asylum
- pop_type
Vector of character values. Possible population type (e.g.: REF, IDP, ASY, OIP, OOC, STA)
Examples
#
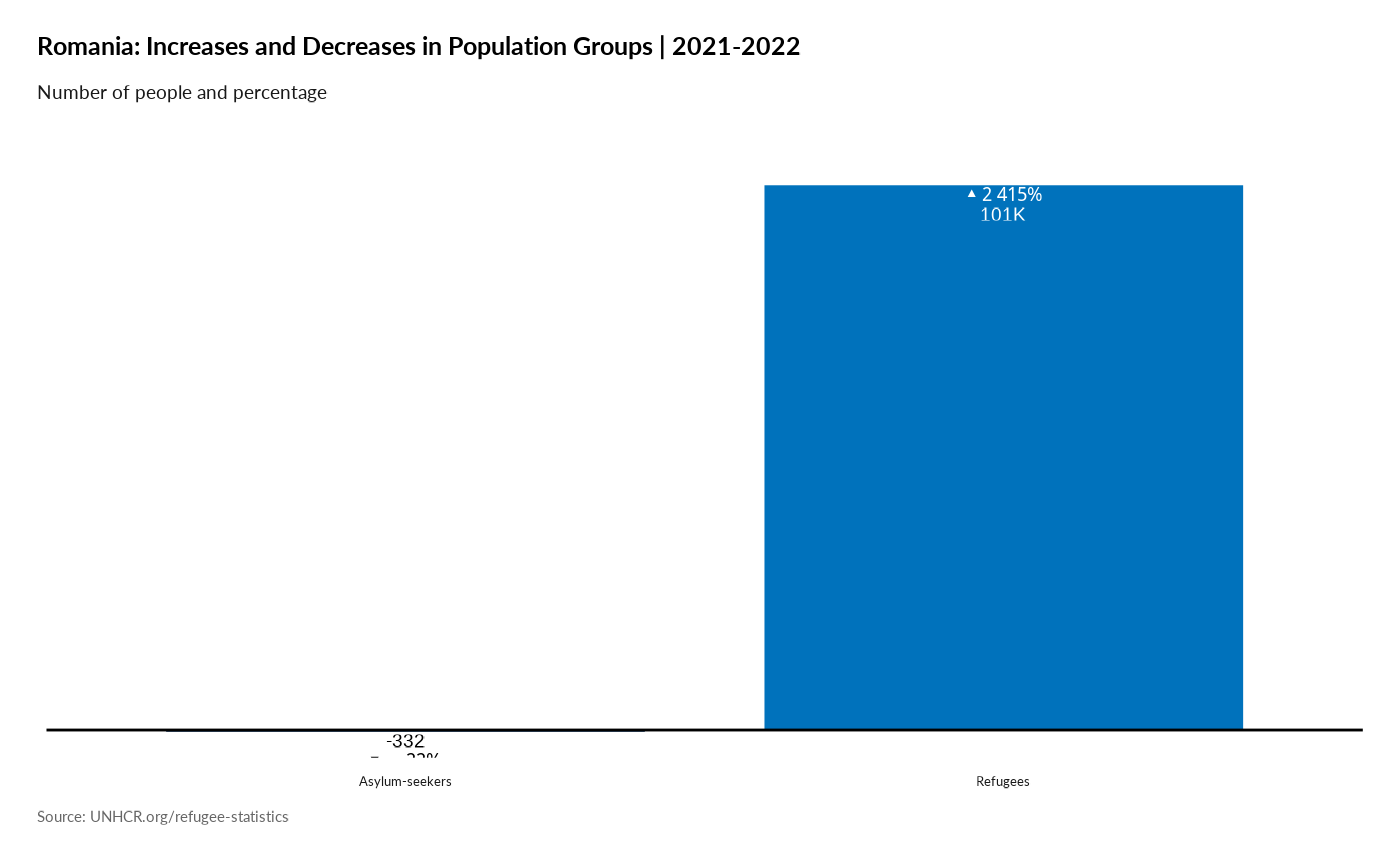
plot_ctr_diff_in_pop_groups(year = 2022,
country_asylum_iso3c = "ROU",
pop_type = c("REF", "ASY")
)
#> Warning: Returning more (or less) than 1 row per `summarise()` group was deprecated in
#> dplyr 1.1.0.
#> ℹ Please use `reframe()` instead.
#> ℹ When switching from `summarise()` to `reframe()`, remember that `reframe()`
#> always returns an ungrouped data frame and adjust accordingly.
#> ℹ The deprecated feature was likely used in the unhcrdatapackage package.
#> Please report the issue at
#> <https://github.com/edouard-legoupil/unhcrdatapackage/issues>.