Display evoluation over time for specific population group (one or many) and defined number of years (lag)
Usage
plot_reg_evolution(
  year = 2022,
  lag = 5,
  region,
  pop_type = c("REF", "IDP", "ASY", "OOC", "STA", "OIP")
)
Arguments
- year
Numeric value of the year (for instance 2020)
- lag
Number of year to used as comparison base
- region
Character value with the related UNHCR bureau - when left null, it will display the whole world
- pop_type
Character value. Possible population type (e.g.: REF, IDP, ASY, OIP, OOC, STA)
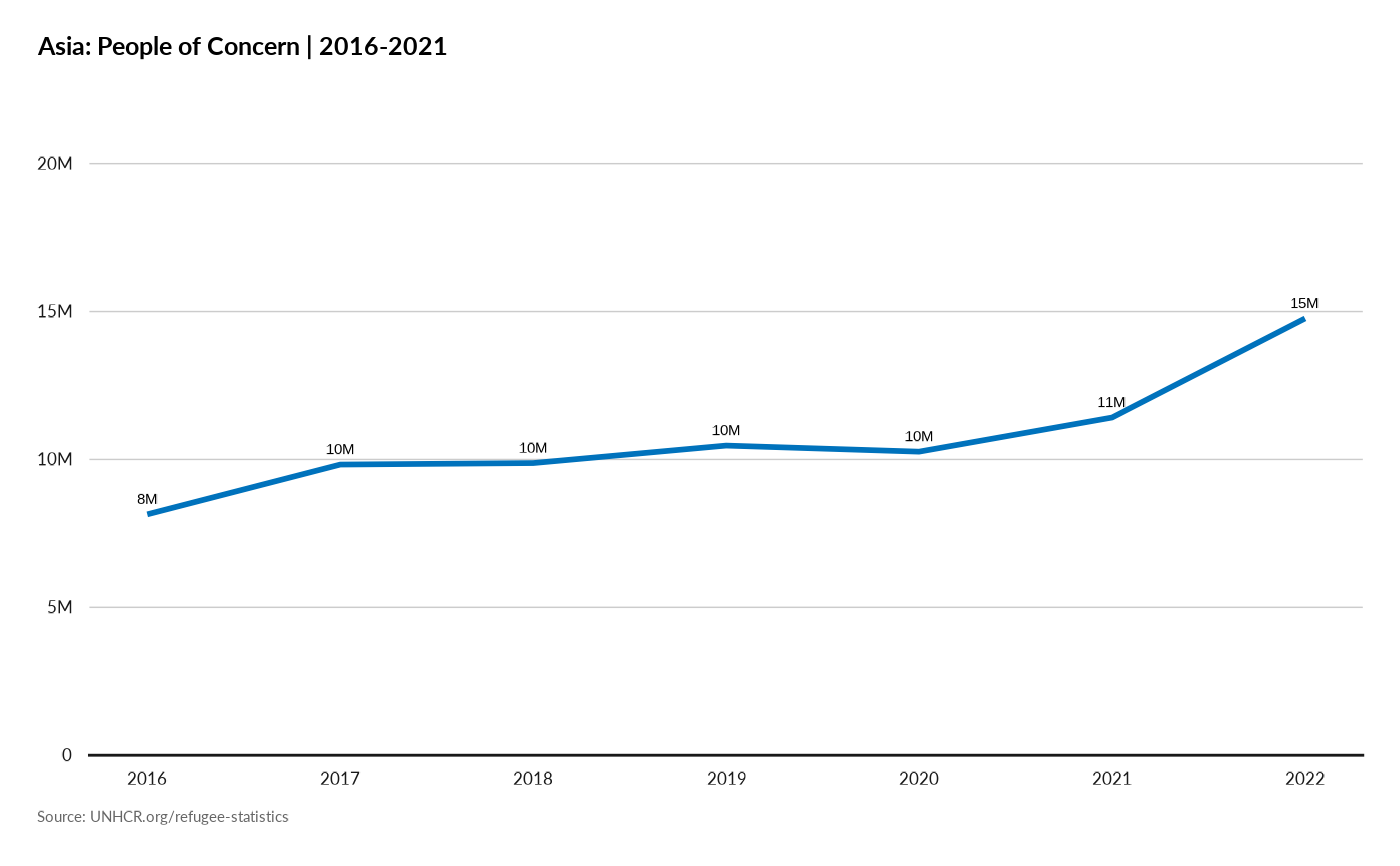
Examples
plot_reg_evolution(year = 2021,
                   lag = 5,
                   region = "Asia",
                   pop_type =  c( "REF", "IDP", "ASY", "OOC", "STA", "OIP"))