Plot a regional map
Usage
plot_reg_map(
  year = 2022,
  region = "Americas",
  topn = 5,
  pop_type = c("REF", "ASY", "OIP"),
  projection = "Mercator",
  maxSymbolsize = 0.25
)
Arguments
- year
Numeric value of the year (for instance 2020)
- region
Character value with the related UNHCR bureau - when left null, it will display the whole world
- topn
how many top countries to show..
- pop_type
Vector of character values. Possible population type (e.g.: REF, IDP, ASY, OIP, OOC, STA)
- projection
use a projection system - default is "Mercator" for instance this can be Bertin 1953 projection - https://visionscarto.net/bertin-projection-1953)
- maxSymbolsize
size in point to adjust for the maximum value to display on the map
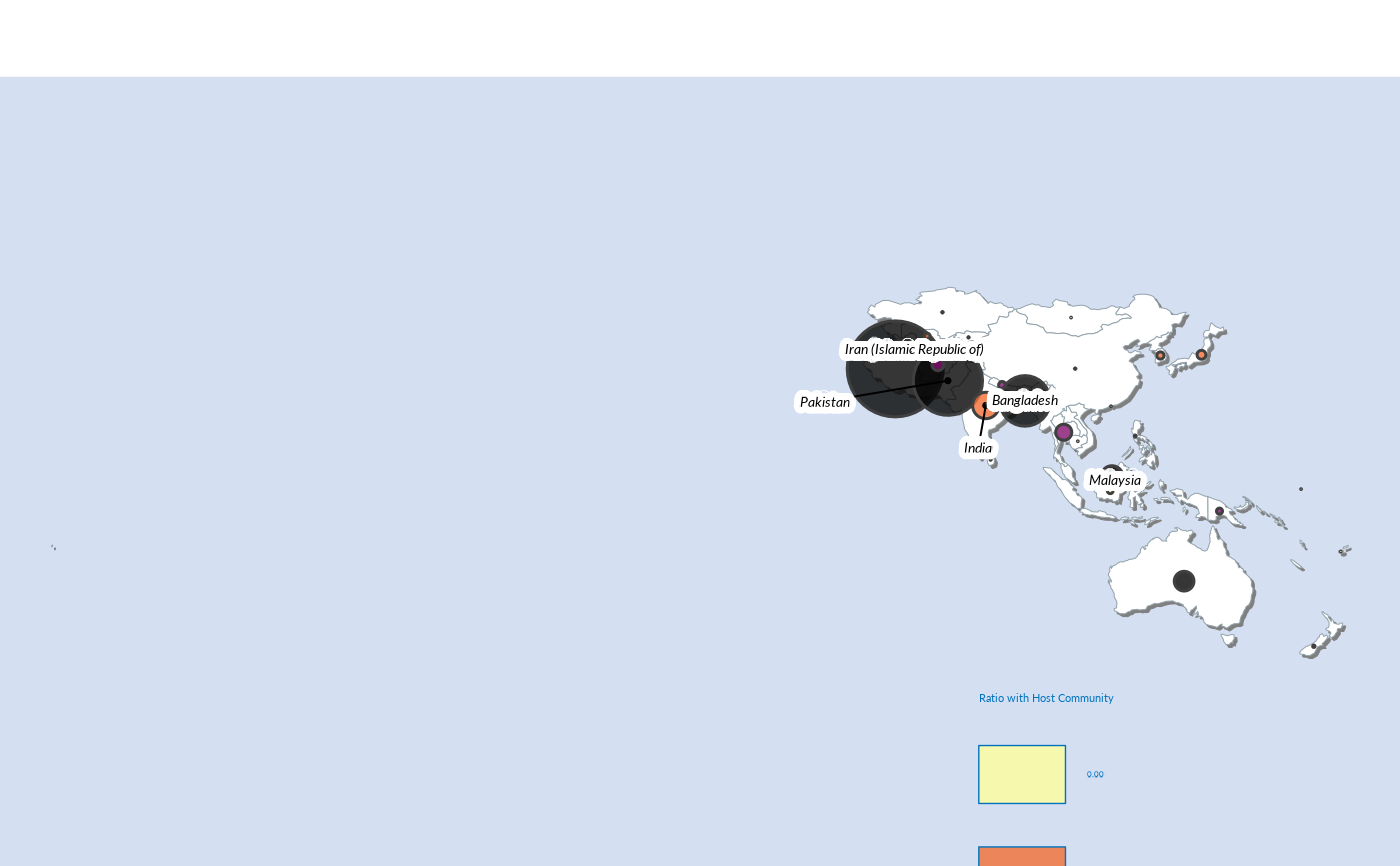
Examples
plot_reg_map(  year = 2022,
                            region = "Asia",
                            topn = 5,
                            pop_type =  c("REF", "ASY", "OIP"),
                            projection = "Mercator",
                            maxSymbolsize = .25)
#> Warning: GDAL Message 1: +init=epsg:XXXX syntax is deprecated. It might return a CRS with a non-EPSG compliant axis order.


# plot_reg_map(  year = 2022,
#                             region = "WestAfrica",
#                             topn = 5,
#                             pop_type =  c("REF", "ASY", "OIP"),
#                             projection = "Mercator",
#                             maxSymbolsize = .25)
# plot_reg_map( year = 2022,
# region = "WestAfrica",
# topn = 5,
# pop_type = c("REF", "ASY", "OIP"),
# projection = "Mercator",
# maxSymbolsize = .25)