Population group in the region
Usage
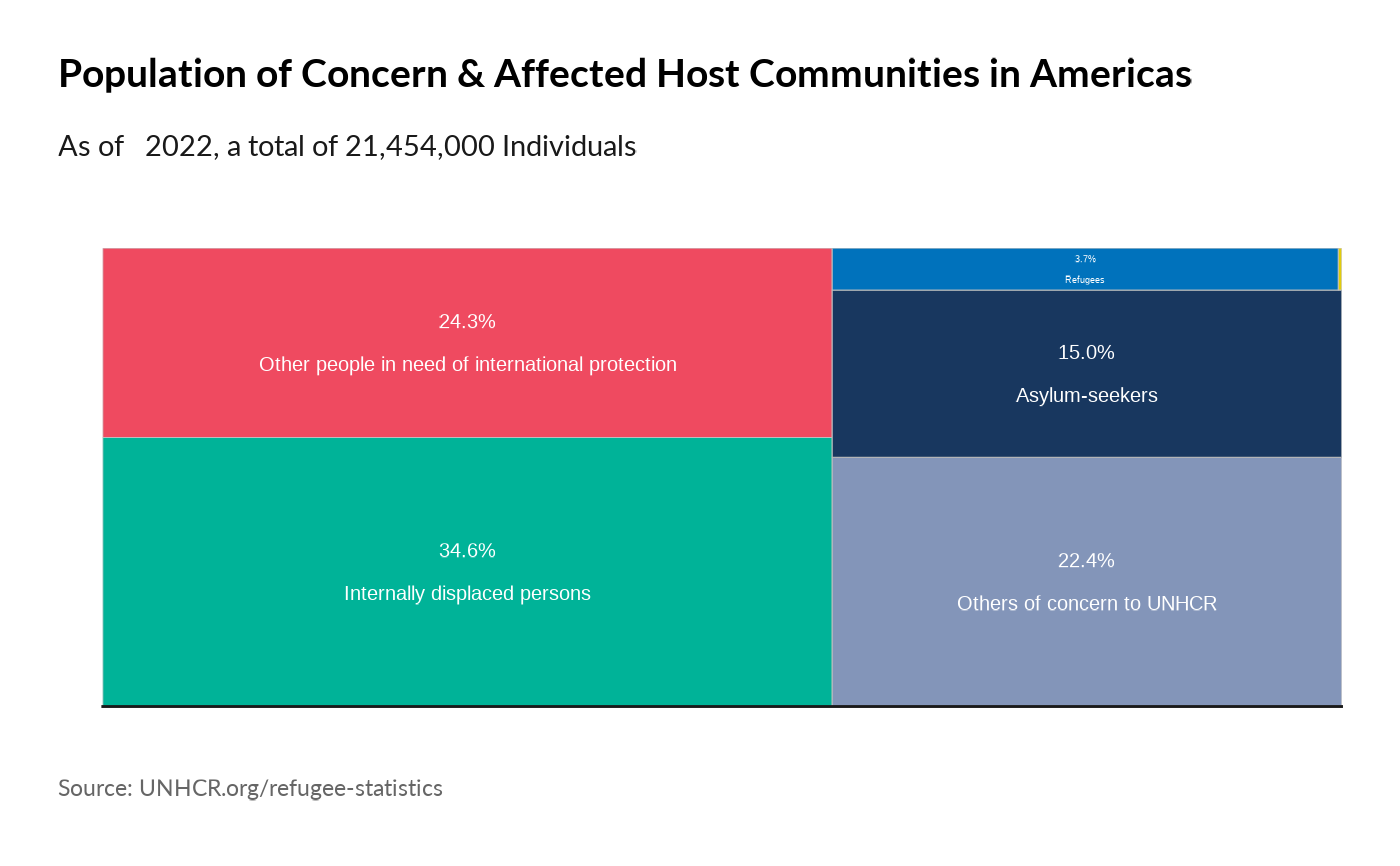
plot_reg_treemap(
  year = 2022,
  region = "Americas",
  pop_type = c("REF", "ASY", "IDP", "OIP", "STA", "OOC")
)Population group in the region
plot_reg_treemap(
year = 2022,
region = "Americas",
pop_type = c("REF", "ASY", "IDP", "OIP", "STA", "OOC")
)