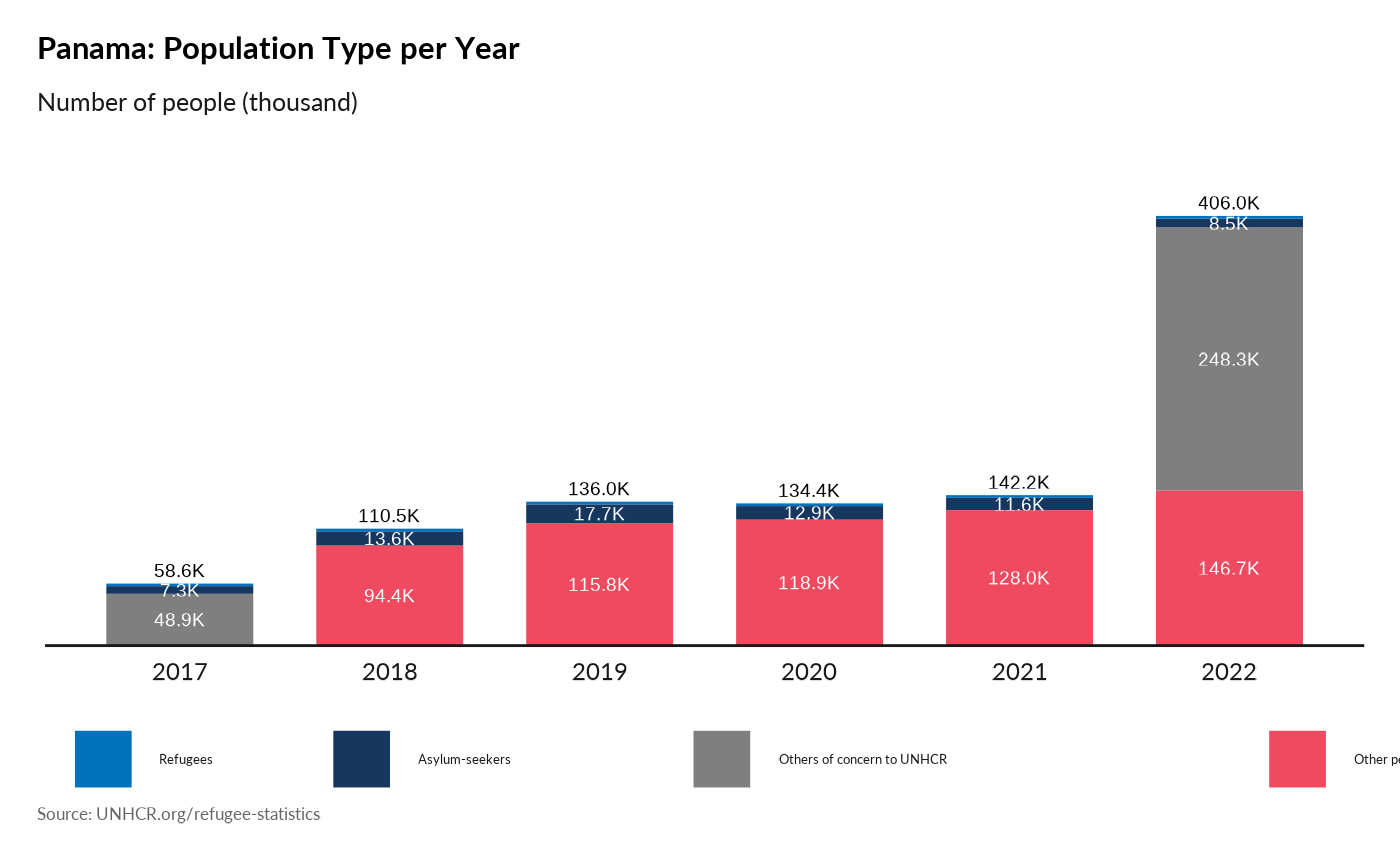
Graph of Population Type Over Year
Source:R/plot_ctr_population_type_per_year.R
plot_ctr_population_type_per_year.RdGraph of Population Type Over Year
Usage
plot_ctr_population_type_per_year(
  year = 2022,
  lag = 5,
  country_asylum_iso3c = country_asylum_iso3c,
  pop_type = Population.type
)
Arguments
- year
Numeric value of the year (for instance 2020)
- lag
Number of year to used as comparison base
- country_asylum_iso3c
Character value with the ISO-3 character code of the Country of Asylum
- pop_type
Vector of character values. Possible population type (e.g.: REF, IDP, ASY, OIP, OIP, OOC, STA)
Examples
p <- plot_ctr_population_type_per_year(
                         year = 2022,
                         country_asylum_iso3c = "PAN",
                         lag = 5,
                         pop_type = c("REF",
                                       "ASY",
                                       "OIP",
                                       "OOC",
                                       "STA",
                                       "IDP" )
                  )
p

## Raw data can always be accessed with
#knitr::kable(ggplot2::ggplot_build(p)$plot$data )
## Raw data can always be accessed with
#knitr::kable(ggplot2::ggplot_build(p)$plot$data )