Plotting ratio Refugee/Asylum-seekers vs Migrant within a country
Source:R/plot_ctr_disp_migrant.R
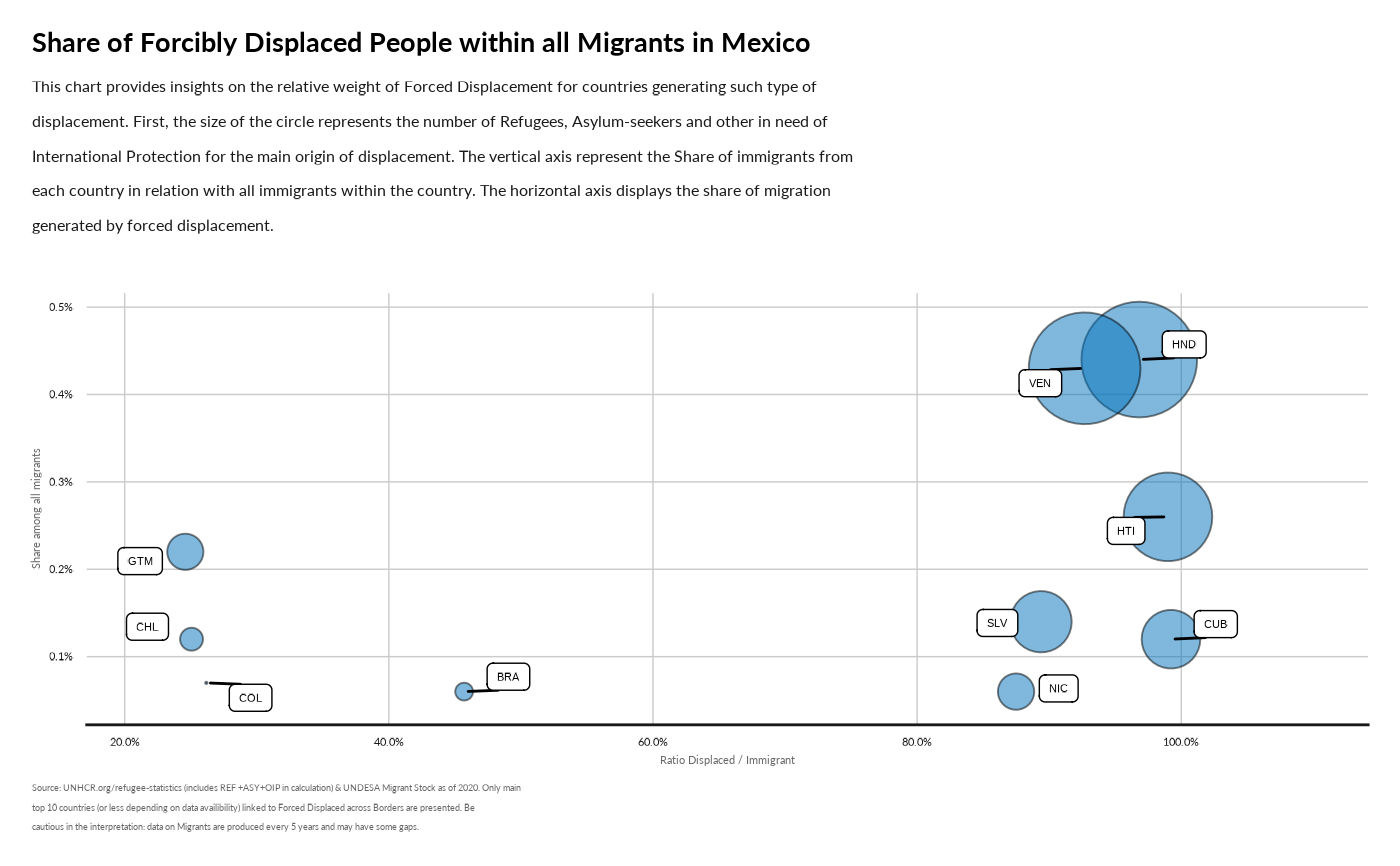
plot_ctr_disp_migrant.RdThis chart provides insights on the relative weight of Forced Displacement for countries generating such type of displacement. First, the size of the circle represents the number of Refugees, Asylum-seekers and other in need of International Protection The vertical axis represent the Share of immigrants from the country in relation with all immigrants within the country. The higher is country in this axis, the more people from this country are the host country independently of the reason why they migrated. The horizontal axis displays the share of migration generated by forced displacement within each country of origin. The more a country is right, the more people from that country cam because of Forced Displacement.