A simple chart to compare a population group between the Region and the rest of the world
Source:R/plot_reg_share.R
plot_reg_share.RdSimple treemap charts to do the comparison
Arguments
- year
Numeric value of the year (for instance 2020)
- region
Character value with the related UNHCR bureau - when left null, it will display the whole world
- pop_type
Vector of character values. Possible population type (e.g.: REF, IDP, ASY, OIP, OOC, STA)
Examples
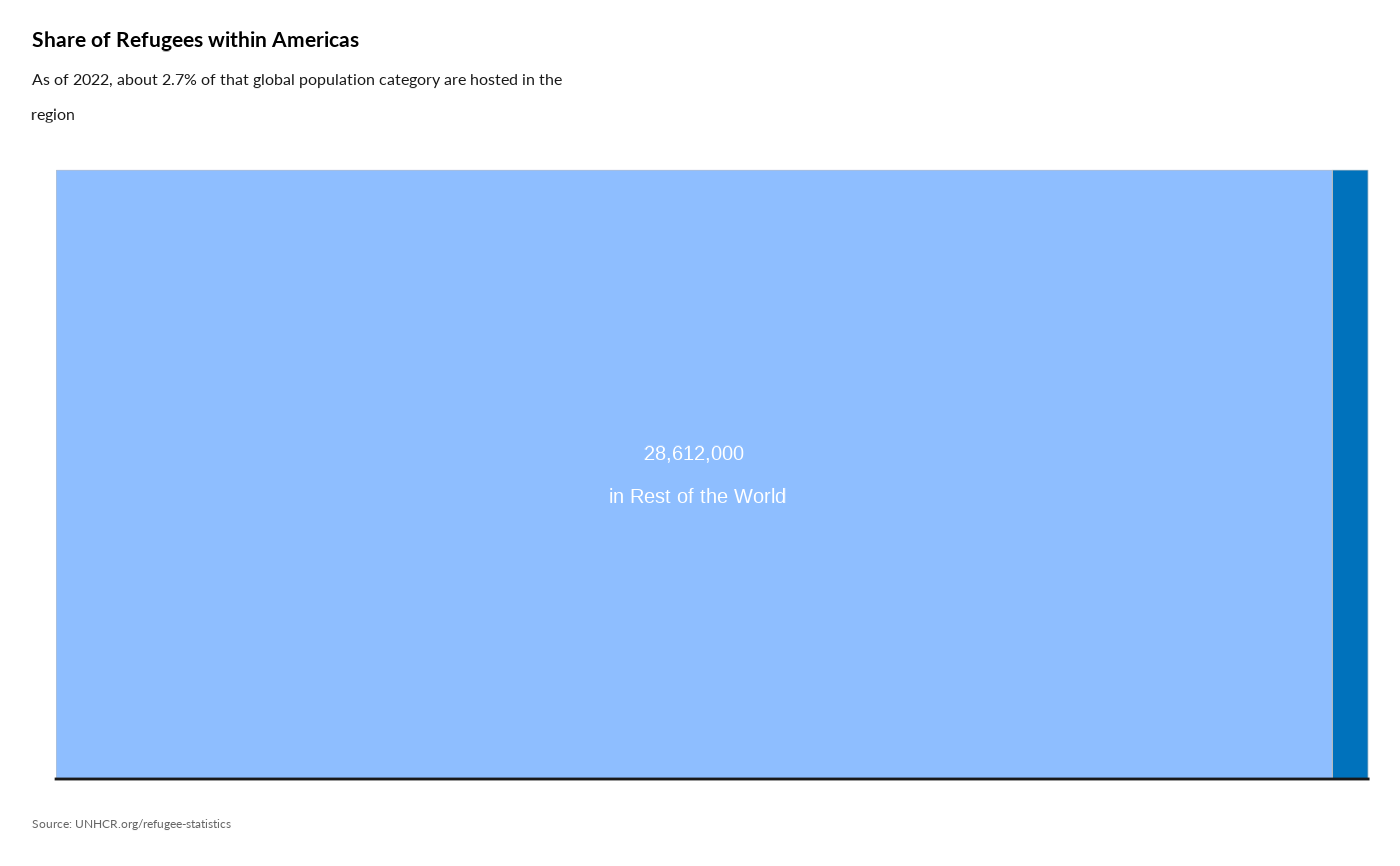
plot_reg_share(year = 2022,
region = "Americas",
pop_type = "REF")
#> Warning: Use of `datatree$Value` is discouraged.
#> ℹ Use `Value` instead.
#> Warning: Use of `datatree$Value` is discouraged.
#> ℹ Use `Value` instead.
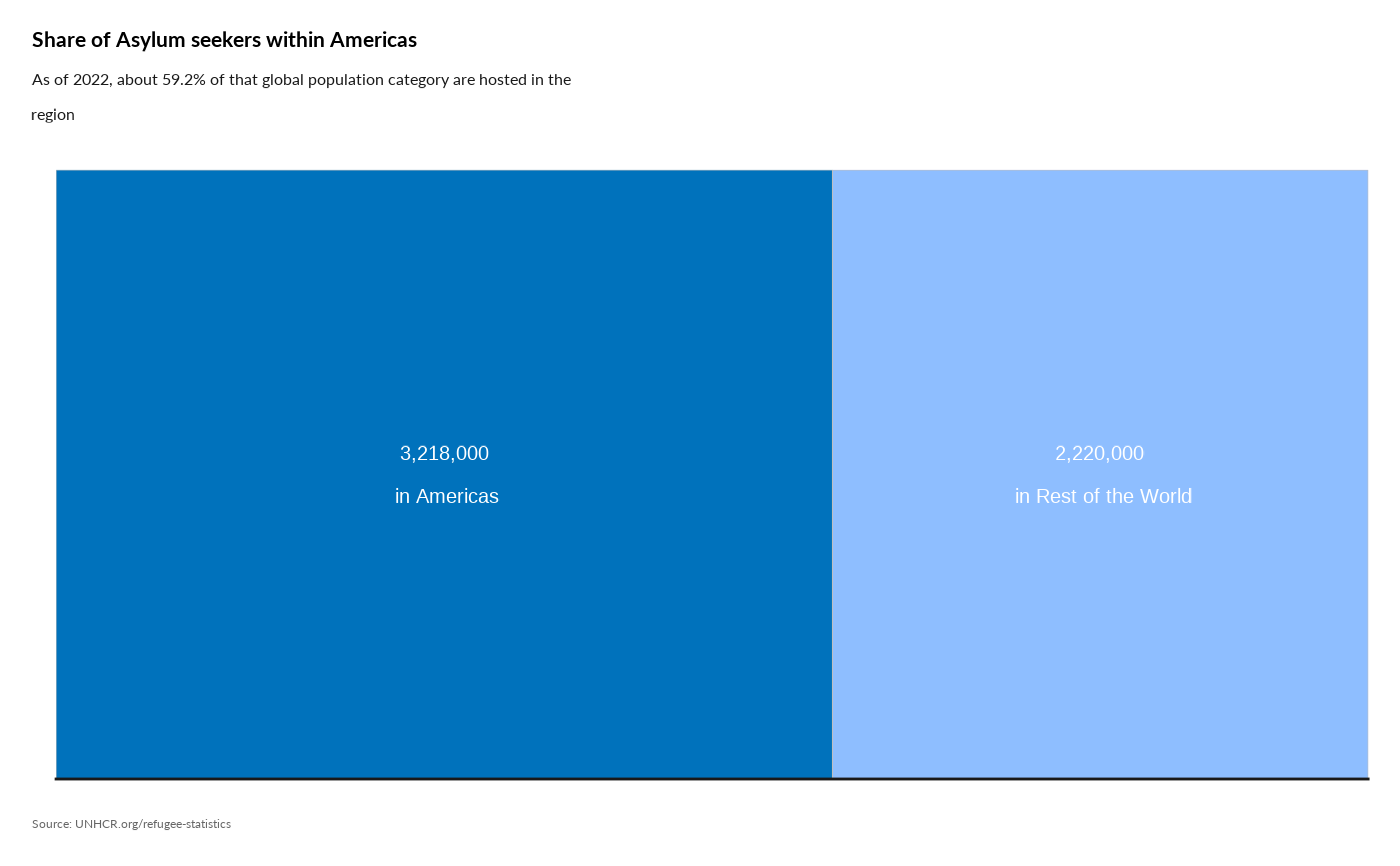
 plot_reg_share(year = 2022,
region = "Americas",
pop_type = "ASY")
#> Warning: Use of `datatree$Value` is discouraged.
#> ℹ Use `Value` instead.
#> Warning: Use of `datatree$Value` is discouraged.
#> ℹ Use `Value` instead.
plot_reg_share(year = 2022,
region = "Americas",
pop_type = "ASY")
#> Warning: Use of `datatree$Value` is discouraged.
#> ℹ Use `Value` instead.
#> Warning: Use of `datatree$Value` is discouraged.
#> ℹ Use `Value` instead.
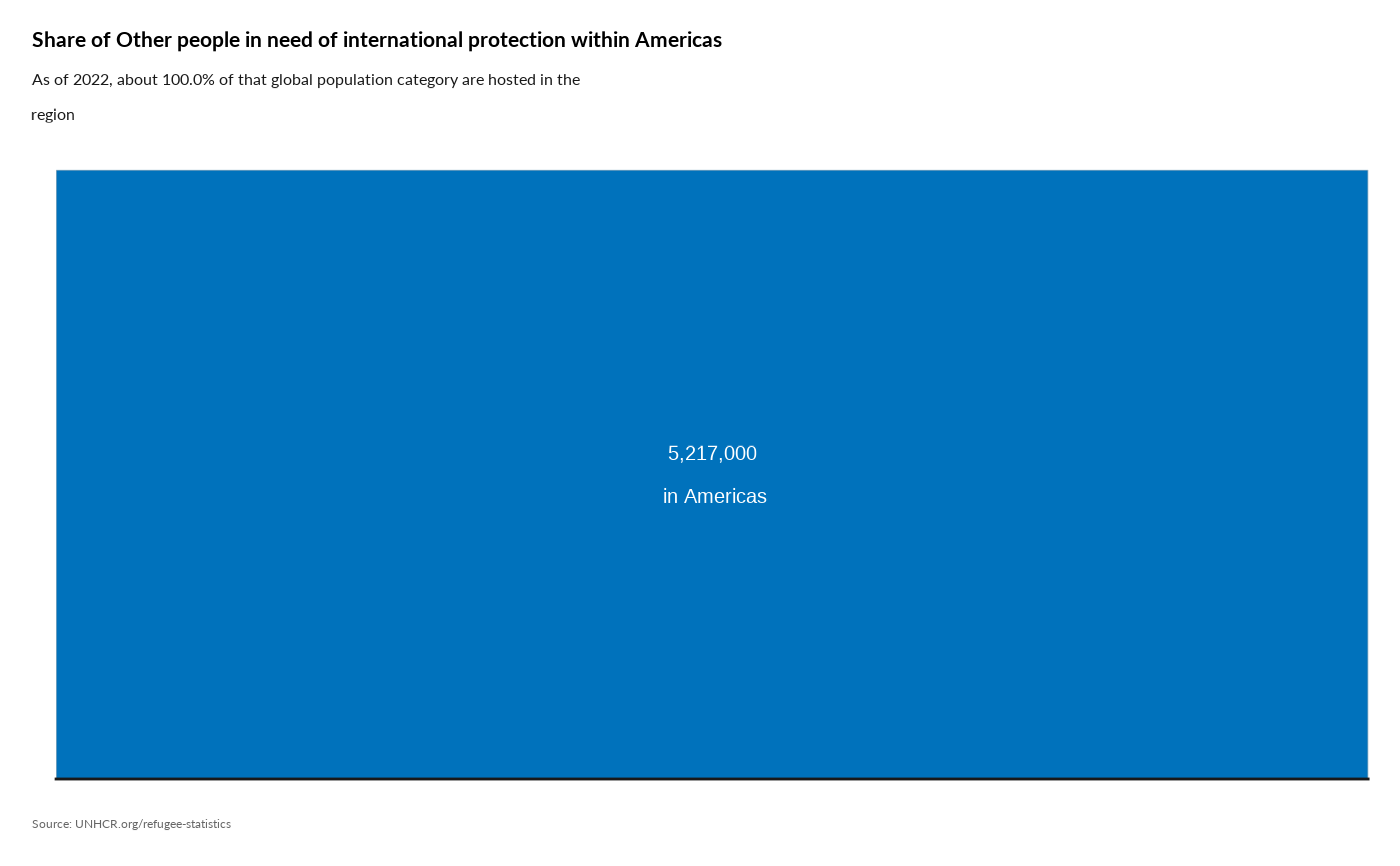
 plot_reg_share(year = 2022,
region = "Americas",
pop_type = "OIP")
#> Warning: Use of `datatree$Value` is discouraged.
#> ℹ Use `Value` instead.
#> Warning: Use of `datatree$Value` is discouraged.
#> ℹ Use `Value` instead.
plot_reg_share(year = 2022,
region = "Americas",
pop_type = "OIP")
#> Warning: Use of `datatree$Value` is discouraged.
#> ℹ Use `Value` instead.
#> Warning: Use of `datatree$Value` is discouraged.
#> ℹ Use `Value` instead.
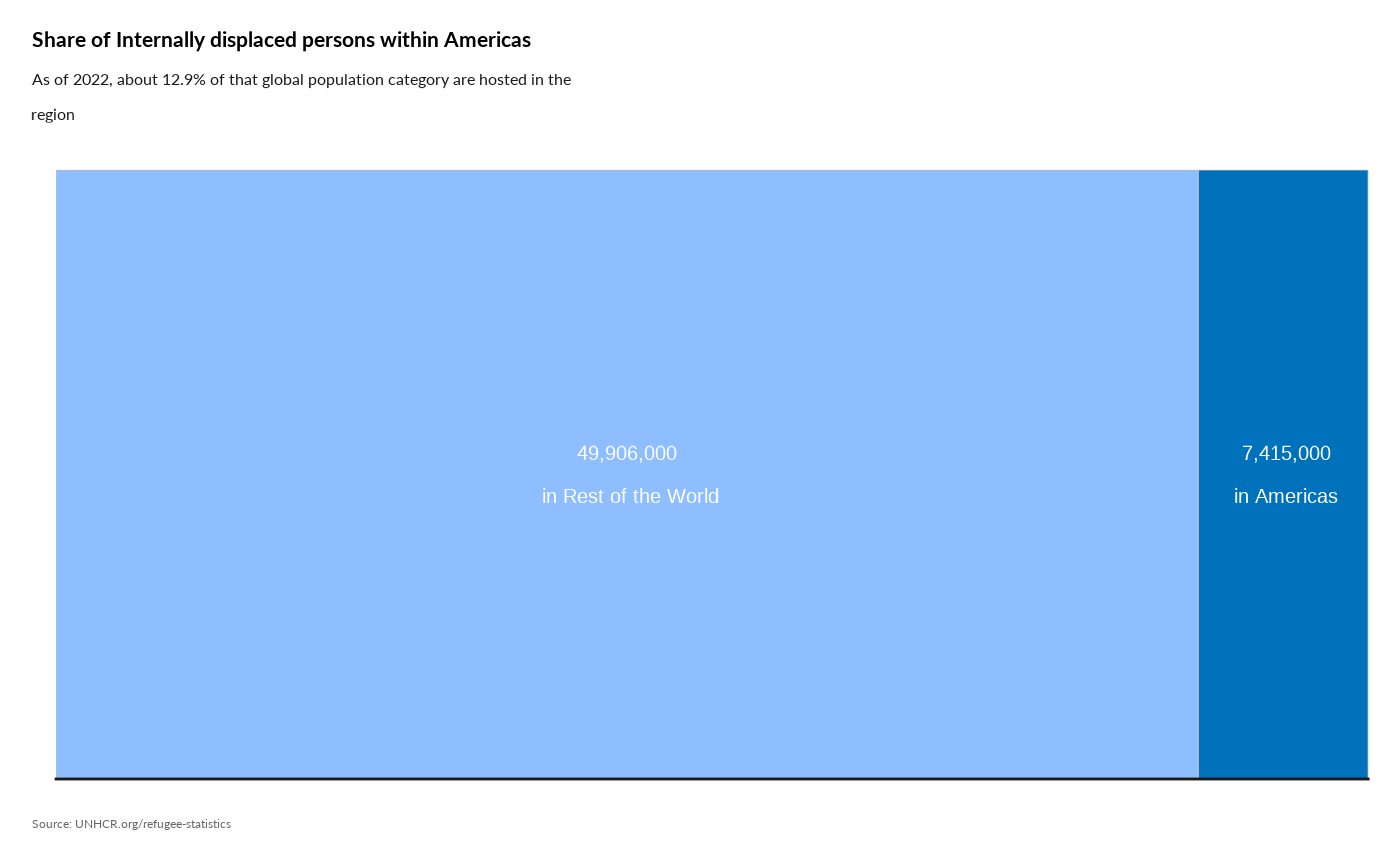
 plot_reg_share(year = 2022,
region = "Americas",
pop_type = "IDP")
#> Warning: Use of `datatree$Value` is discouraged.
#> ℹ Use `Value` instead.
#> Warning: Use of `datatree$Value` is discouraged.
#> ℹ Use `Value` instead.
plot_reg_share(year = 2022,
region = "Americas",
pop_type = "IDP")
#> Warning: Use of `datatree$Value` is discouraged.
#> ℹ Use `Value` instead.
#> Warning: Use of `datatree$Value` is discouraged.
#> ℹ Use `Value` instead.
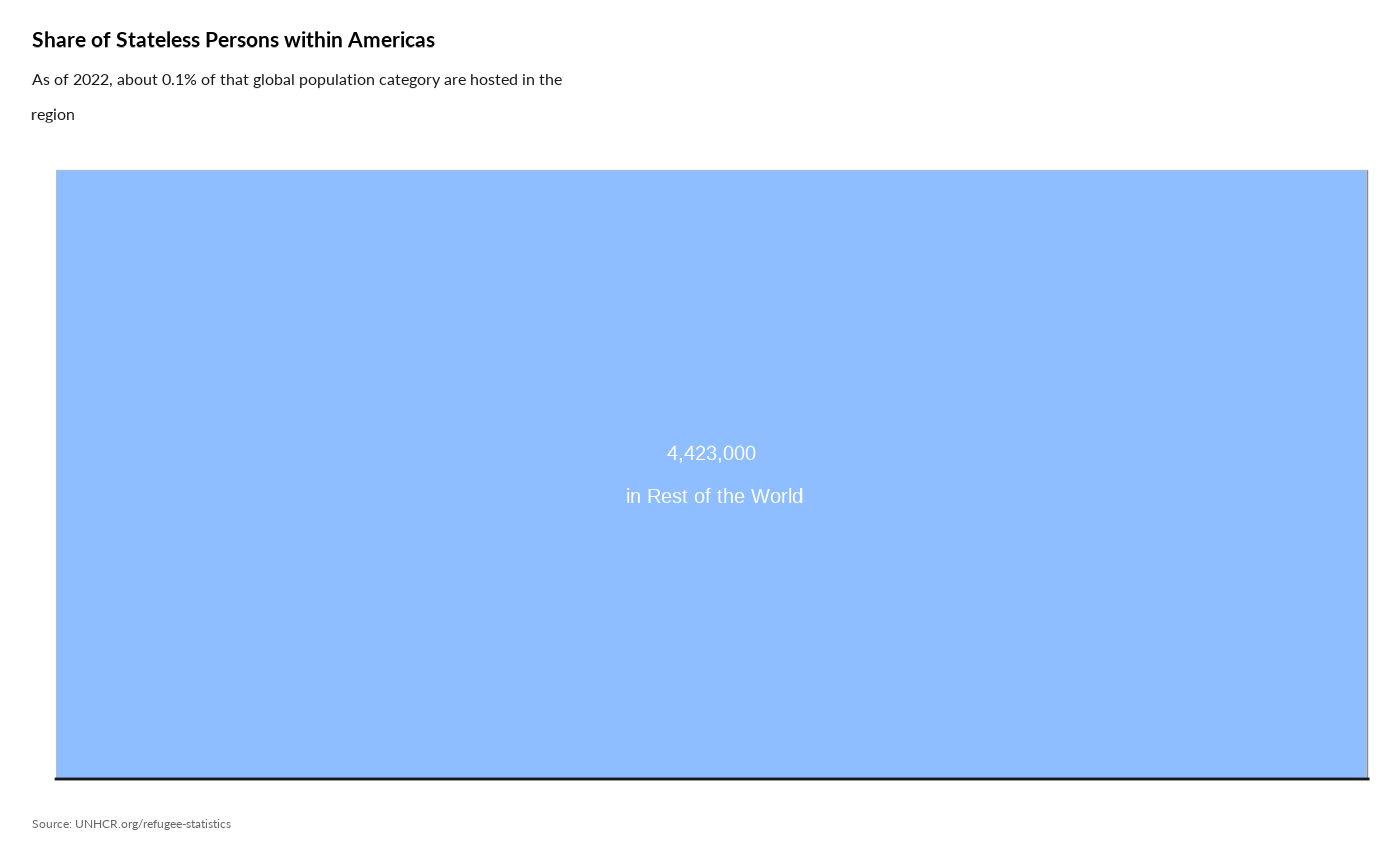
 plot_reg_share(year = 2022,
region = "Americas",
pop_type = "STA")
#> Warning: Use of `datatree$Value` is discouraged.
#> ℹ Use `Value` instead.
#> Warning: Use of `datatree$Value` is discouraged.
#> ℹ Use `Value` instead.
plot_reg_share(year = 2022,
region = "Americas",
pop_type = "STA")
#> Warning: Use of `datatree$Value` is discouraged.
#> ℹ Use `Value` instead.
#> Warning: Use of `datatree$Value` is discouraged.
#> ℹ Use `Value` instead.