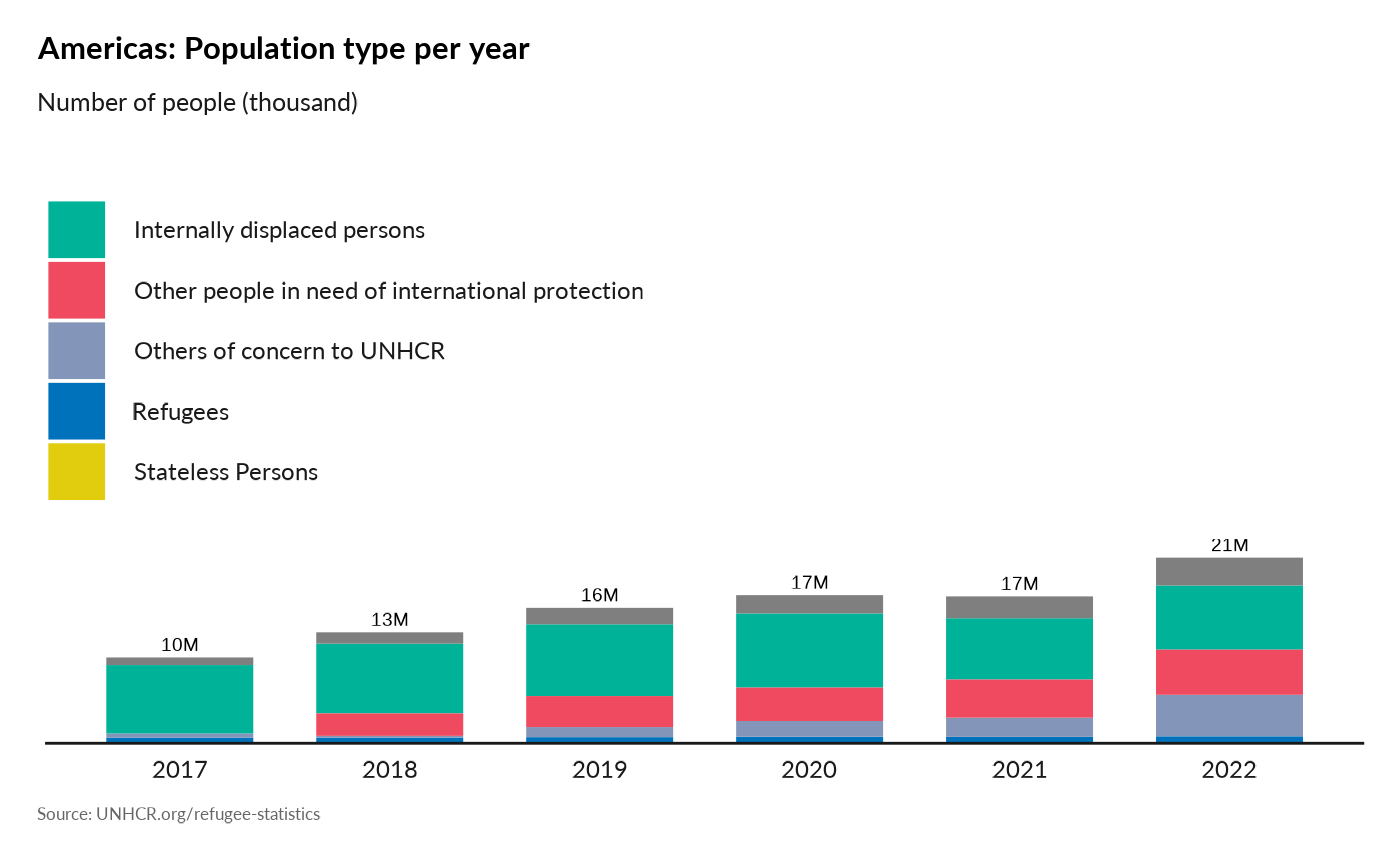
Display evolution of different population type over years
Source:R/plot_reg_population_type_per_year.R
plot_reg_population_type_per_year.RdSummary of Evolution
Usage
plot_reg_population_type_per_year(
  year = 2022,
  lag = 5,
  region,
  pop_type = c("REF", "ASY", "IDP", "OIP", "STA", "OOC")
)
Arguments
- year
Numeric value of the year (for instance 2020)
- lag
Number of year to used as comparison base
- region
Character value with the related UNHCR bureau - when left null, it will display the whole world
- pop_type
Vector of character values. Possible population type (e.g.: REF, IDP, ASY, OIP, OIP, OOC, STA)
Examples
plot_reg_population_type_per_year(year = 2022,
                                              lag = 5,
                                     region  = "Americas",
                                     pop_type =   c("REF", "ASY", "IDP", "OIP", "STA", "OOC") )
#> Warning: The dot-dot notation (`..y..`) was deprecated in ggplot2 3.4.0.
#> ℹ Please use `after_stat(y)` instead.
#> ℹ The deprecated feature was likely used in the unhcrdatapackage package.
#>   Please report the issue at
#>   <https://github.com/edouard-legoupil/unhcrdatapackage/issues>.
