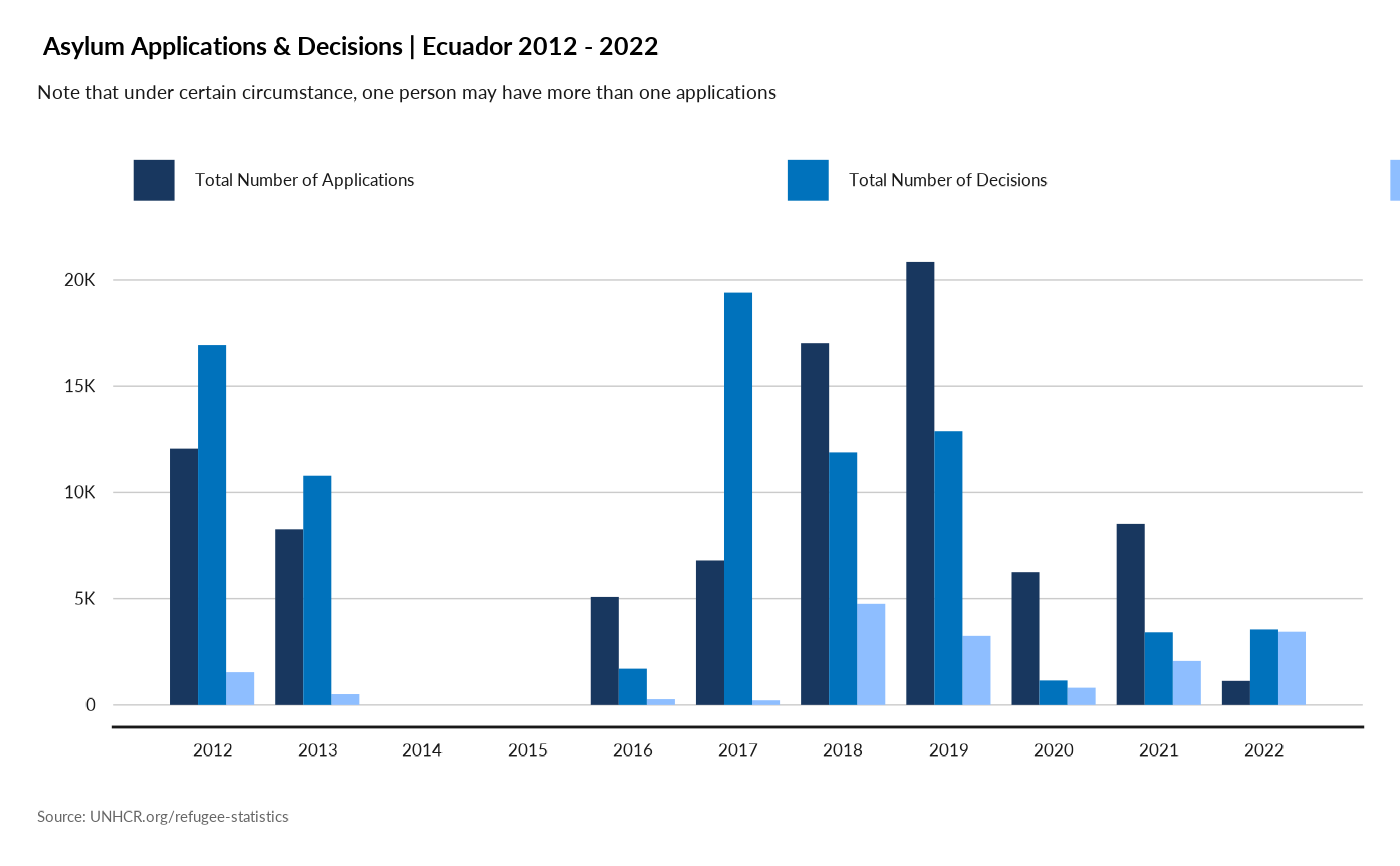
This charts allow to visualize trends in terms of asylum applications, decision and refugee status recognition
Usage
plot_ctr_asylum(
  year = 2022,
  country_asylum_iso3c = country_asylum_iso3,
  lag = 10
)
Arguments
- year
Numeric value of the year (for instance 2020)
- country_asylum_iso3c
Character value with the ISO-3 character code of the Country of Asylum
- lag
Number of year to used as comparison base
Examples
plot_ctr_asylum(year = 2022,
                country_asylum_iso3c = "ECU",
                            lag = 10)
#> Joining with `by = join_by(Year, CountryAsylumCode)`