Tree map of Population Groups within a country
Usage
plot_ctr_treemap(
  year = 2021,
  country_asylum_iso3c = country_asylum_iso3c,
  pop_type = pop_type
)
Arguments
- year
Numeric value of the year (for instance 2020)
- country_asylum_iso3c
Character value with the ISO-3 character code of the Country of Asylum
- pop_type
Vector of character values. Possible population type (e.g.: REF, IDP, ASY, OIP, OOC, STA)
Examples
#
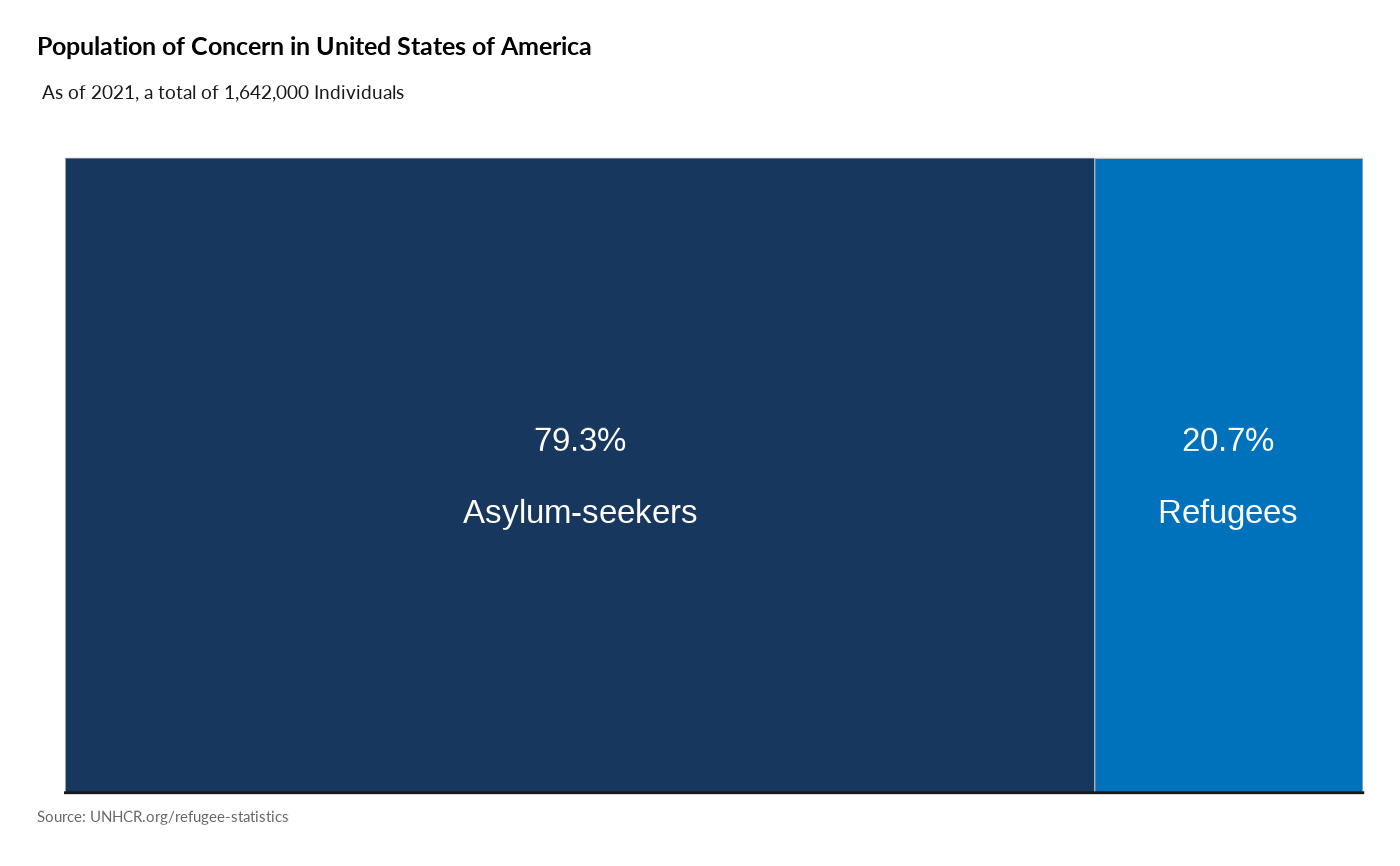
plot_ctr_treemap(year = 2021,
country_asylum_iso3c = "USA",
pop_type = c("REF", "ASY")
)