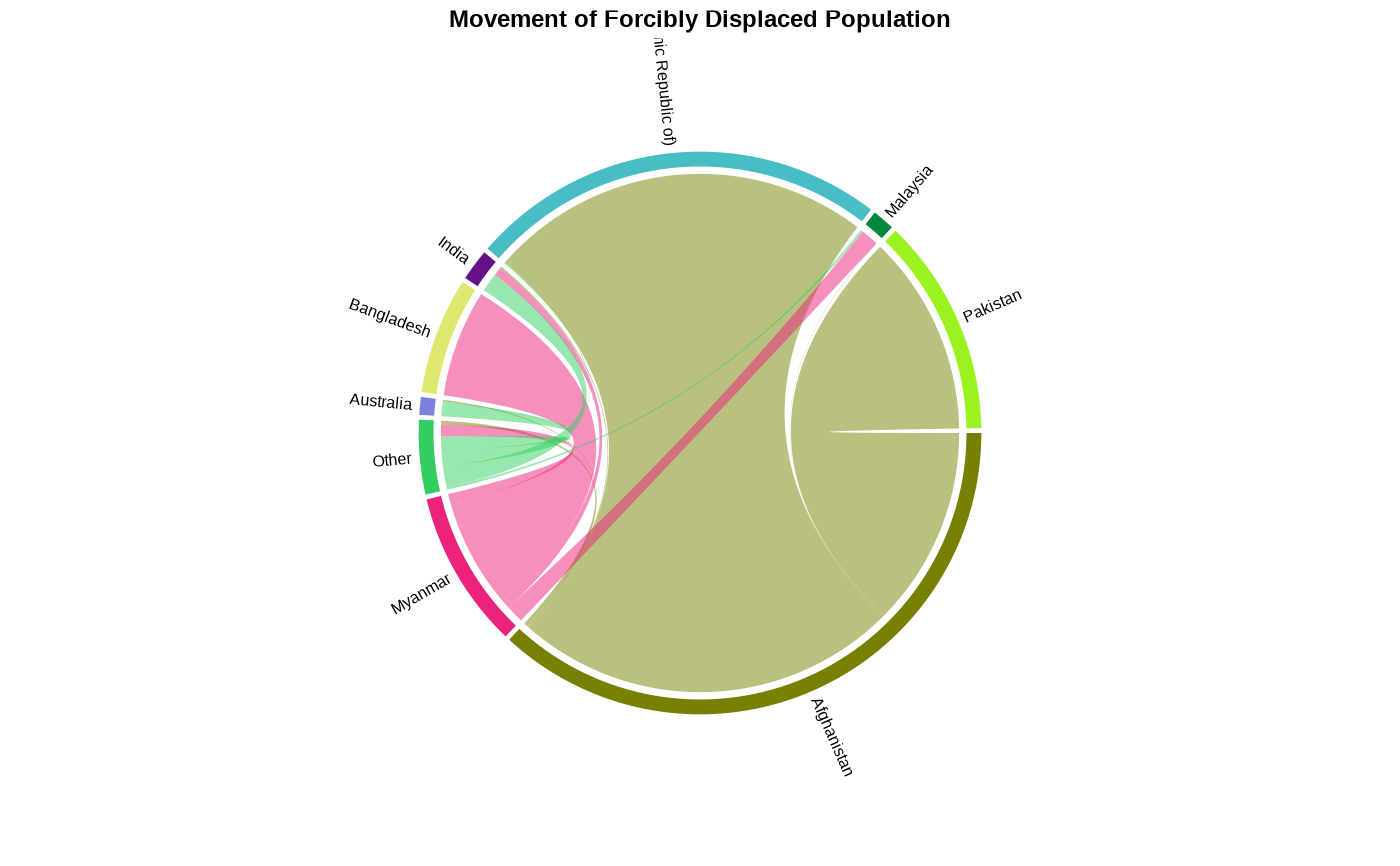
Plot Population Origin-Destination within the region
Source:R/plot_reg_origin_dest.R
plot_reg_origin_dest.RdChord diagram showing Origin destination see - https://jokergoo.github.io/circlize_book/book/
R/plot_reg_origin_dest.R
plot_reg_origin_dest.RdChord diagram showing Origin destination see - https://jokergoo.github.io/circlize_book/book/