library(unhcrdatapackage)
#> Warning: replacing previous import 'shinydashboard::dashboardPage' by
#> 'shinydashboardPlus::dashboardPage' when loading 'unhcrdatapackage'
#> Warning: replacing previous import 'shinydashboard::dashboardSidebar' by
#> 'shinydashboardPlus::dashboardSidebar' when loading 'unhcrdatapackage'
#> Warning: replacing previous import 'shinydashboard::box' by
#> 'shinydashboardPlus::box' when loading 'unhcrdatapackage'
#> Warning: replacing previous import 'shinydashboard::dashboardHeader' by
#> 'shinydashboardPlus::dashboardHeader' when loading 'unhcrdatapackage'
#> Warning: replacing previous import 'shinydashboard::taskItem' by
#> 'shinydashboardPlus::taskItem' when loading 'unhcrdatapackage'
#> Warning: replacing previous import 'shinydashboard::notificationItem' by
#> 'shinydashboardPlus::notificationItem' when loading 'unhcrdatapackage'
#> Warning: replacing previous import 'shinydashboard::messageItem' by
#> 'shinydashboardPlus::messageItem' when loading 'unhcrdatapackage'
#> Registered S3 methods overwritten by 'ggalt':
#>   method                  from
#>   grid.draw.absoluteGrob  ggplot2
#>   grobHeight.absoluteGrob ggplot2
#>   grobWidth.absoluteGrob  ggplot2
#>   grobX.absoluteGrob      ggplot2
#>   grobY.absoluteGrob      ggplot2
#> Warning: replacing previous import 'shinydashboardPlus::box' by
#> 'shinydashboard::box' when loading 'unhcrdatapackage'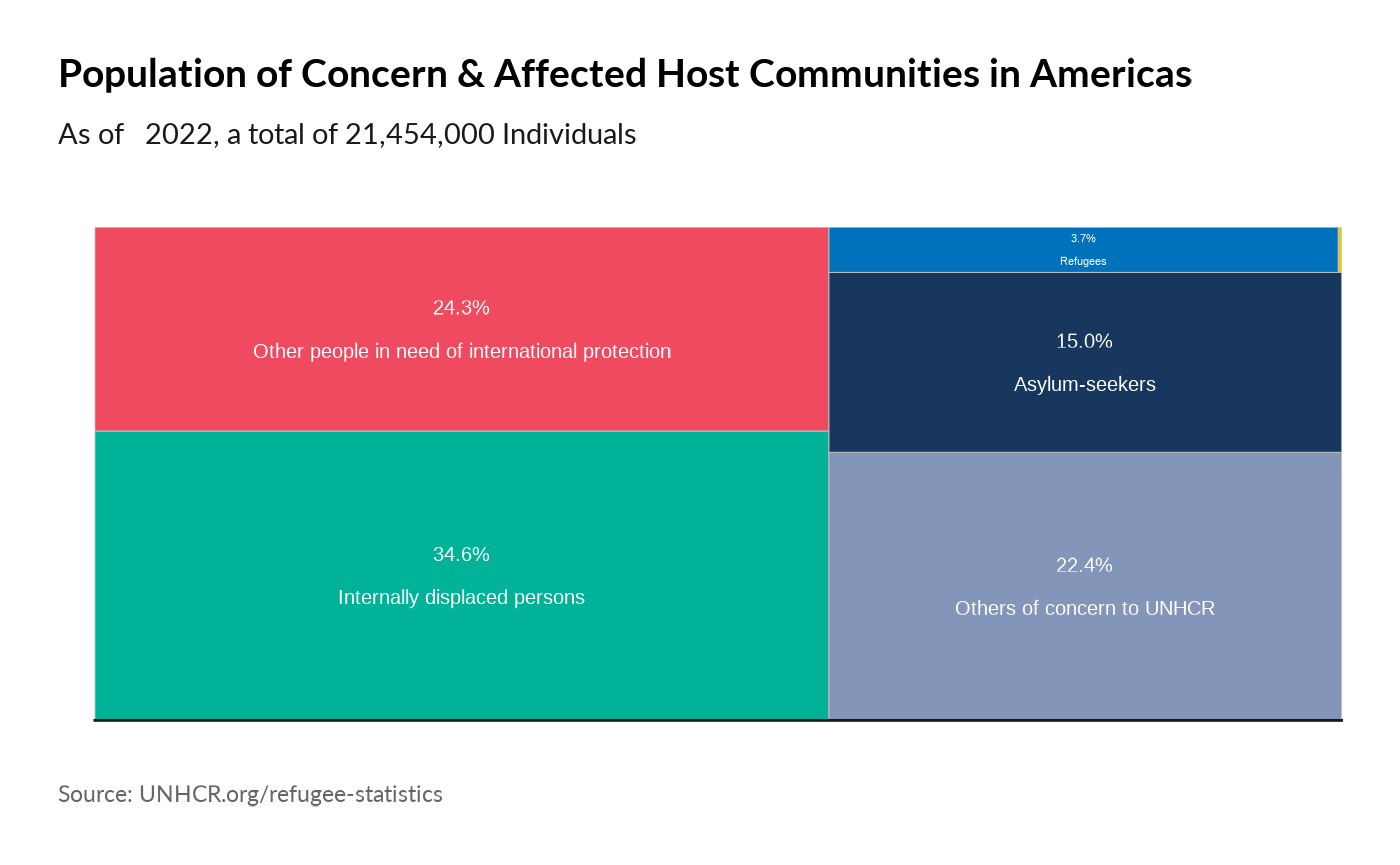
Plot World Comparison
plot_reg_share(year = 2022,
                             region = "Americas",
                             pop_type = "REF")
#> Warning: Use of `datatree$Value` is discouraged.
#> ℹ Use `Value` instead.
#> Use of `datatree$Value` is discouraged.
#> ℹ Use `Value` instead.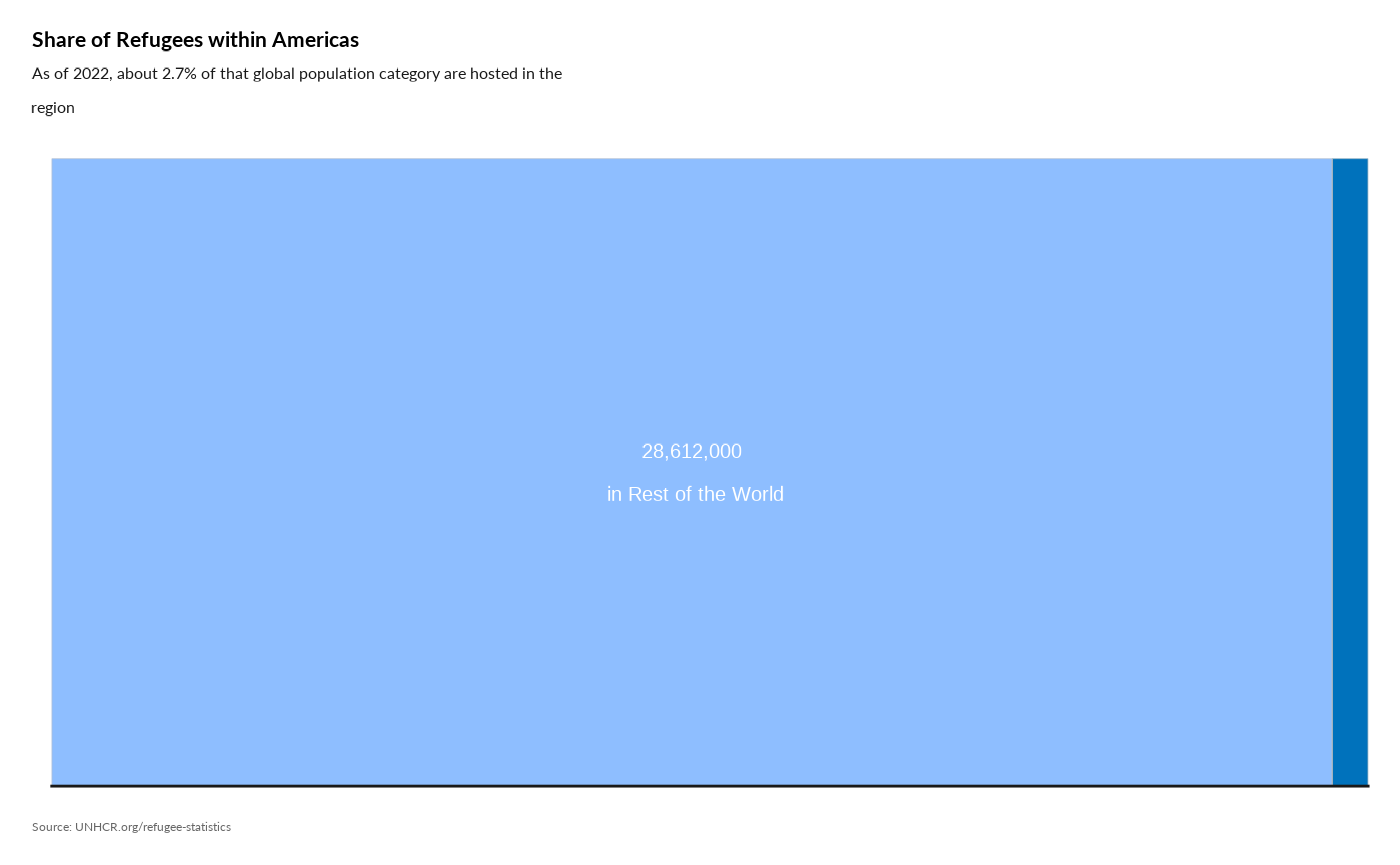
plot_reg_share(year = 2022,
                             region = "Americas",
                             pop_type = "ASY")
#> Warning: Use of `datatree$Value` is discouraged.
#> ℹ Use `Value` instead.
#> Use of `datatree$Value` is discouraged.
#> ℹ Use `Value` instead.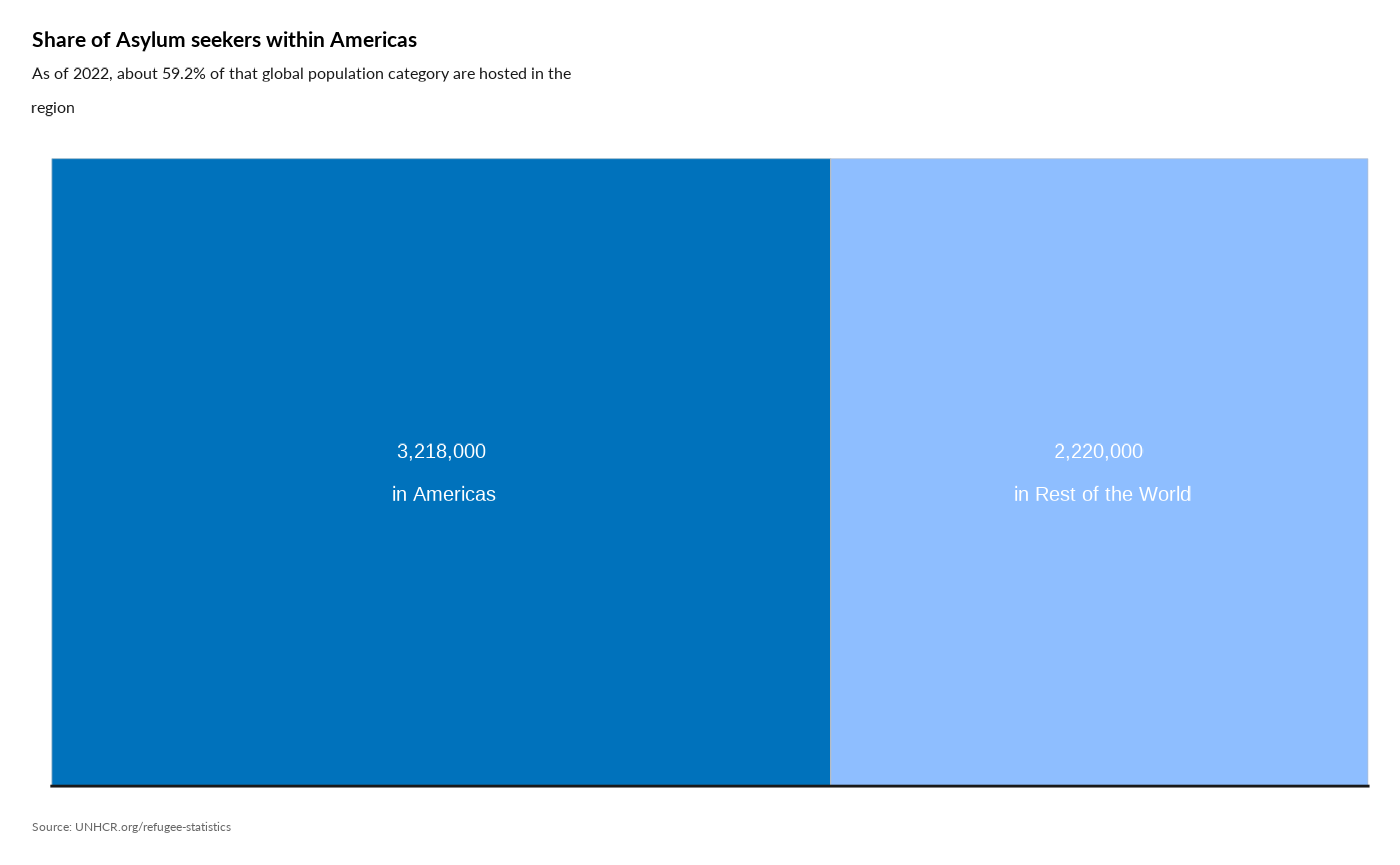
plot_reg_share(year = 2022,
                             region = "Americas",
                             pop_type = "OIP")
#> Warning: Use of `datatree$Value` is discouraged.
#> ℹ Use `Value` instead.
#> Use of `datatree$Value` is discouraged.
#> ℹ Use `Value` instead.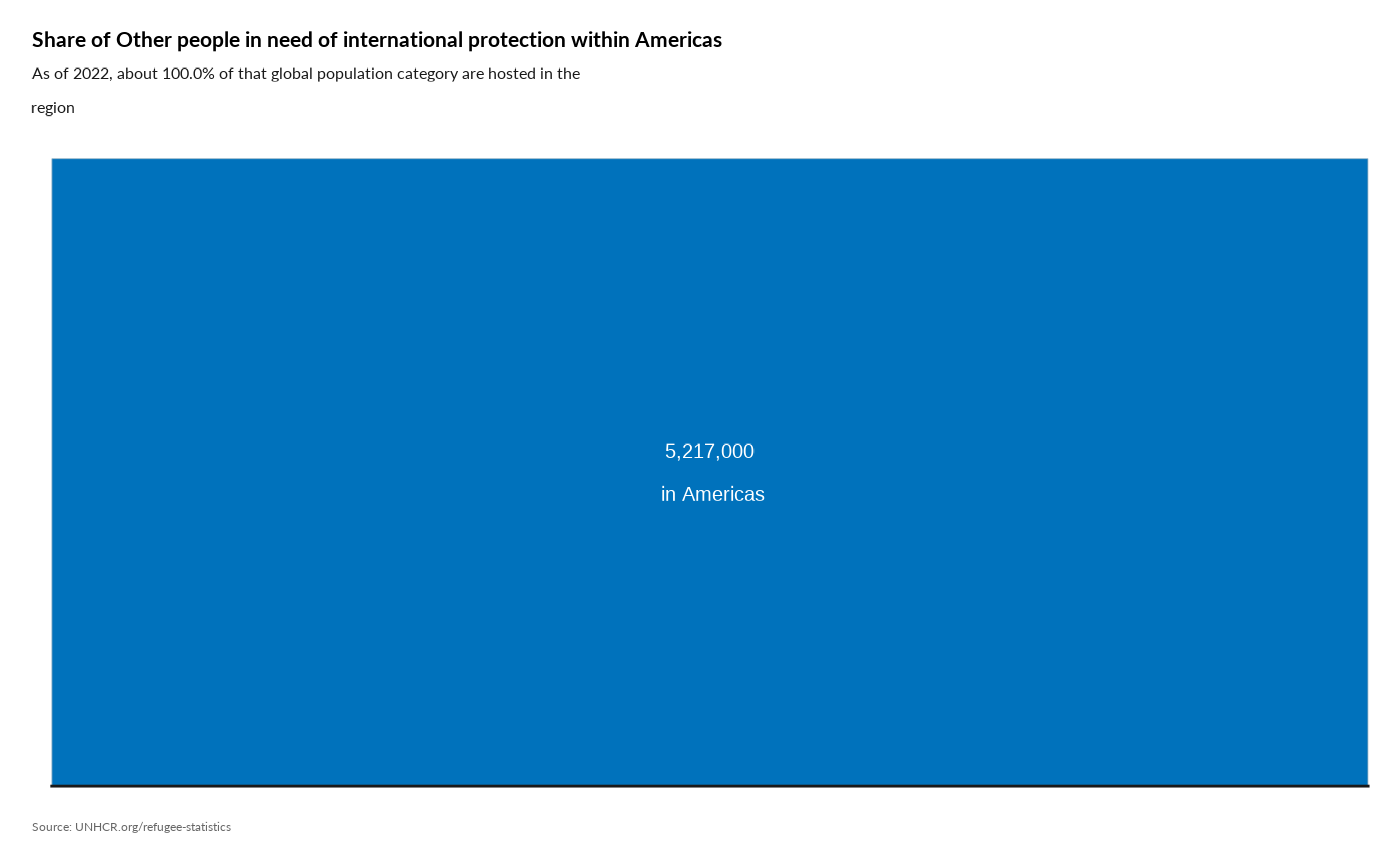
plot_reg_share(year = 2022,
                             region = "Americas",
                             pop_type = "IDP")
#> Warning: Use of `datatree$Value` is discouraged.
#> ℹ Use `Value` instead.
#> Use of `datatree$Value` is discouraged.
#> ℹ Use `Value` instead.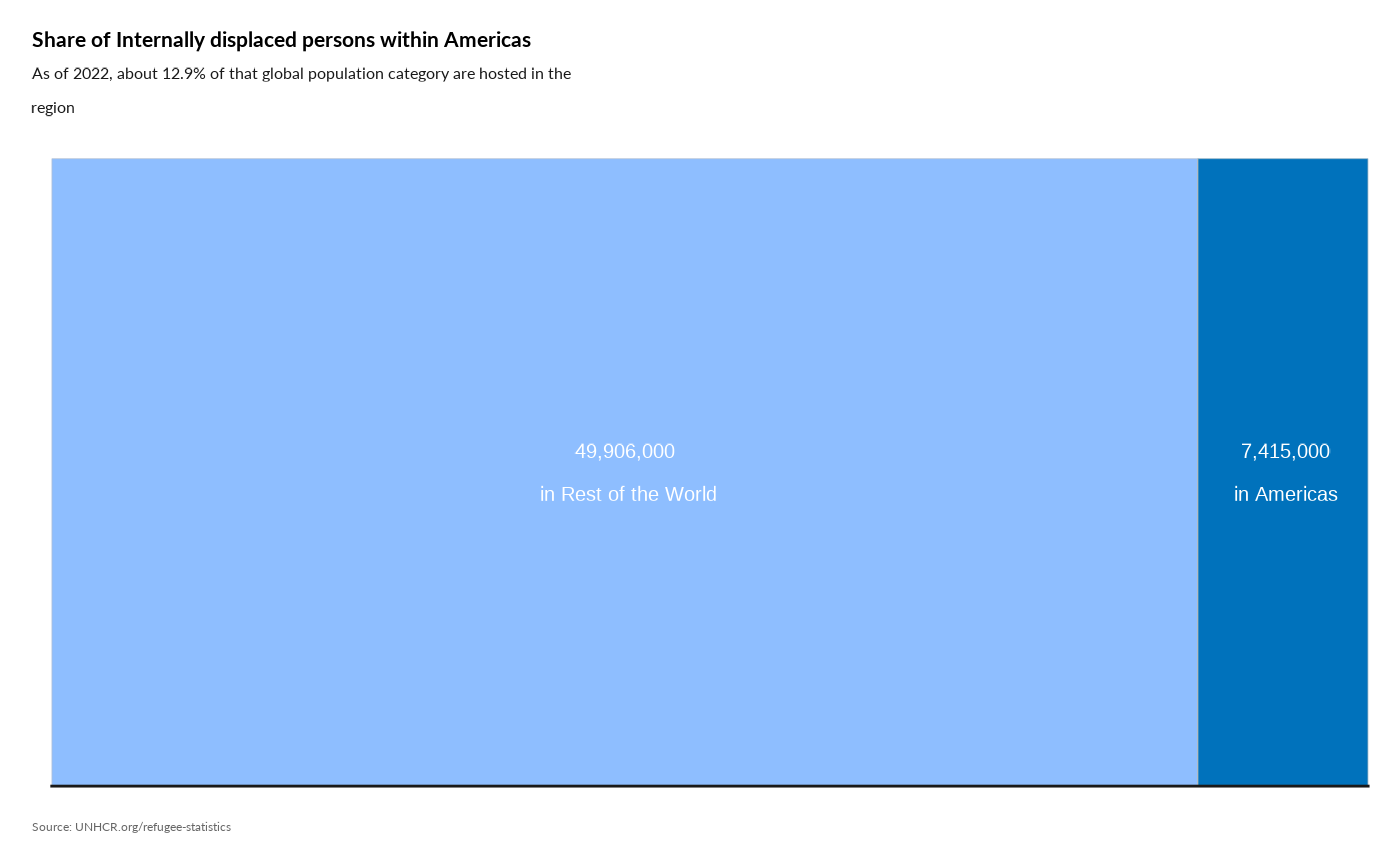
plot_reg_share(year = 2022,
                             region = "Americas",
                             pop_type = "STA")
#> Warning: Use of `datatree$Value` is discouraged.
#> ℹ Use `Value` instead.
#> Use of `datatree$Value` is discouraged.
#> ℹ Use `Value` instead.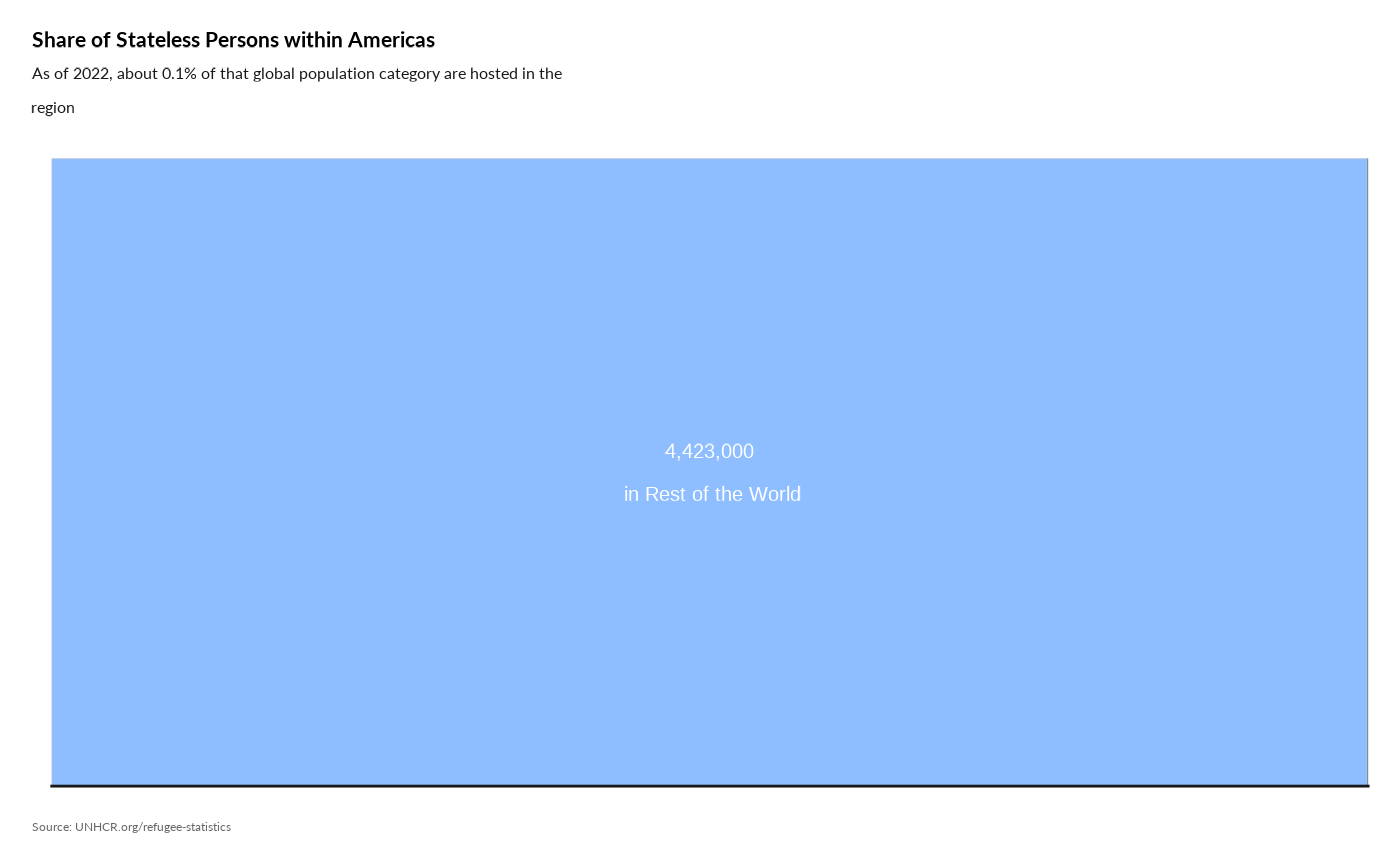
Evolution Over Time
plot_reg_evolution(year = 2021,
                   lag = 5,
                   region = "Asia",
                   pop_type =  c( "REF", "IDP", "ASY", "OOC", "STA", "OIP"))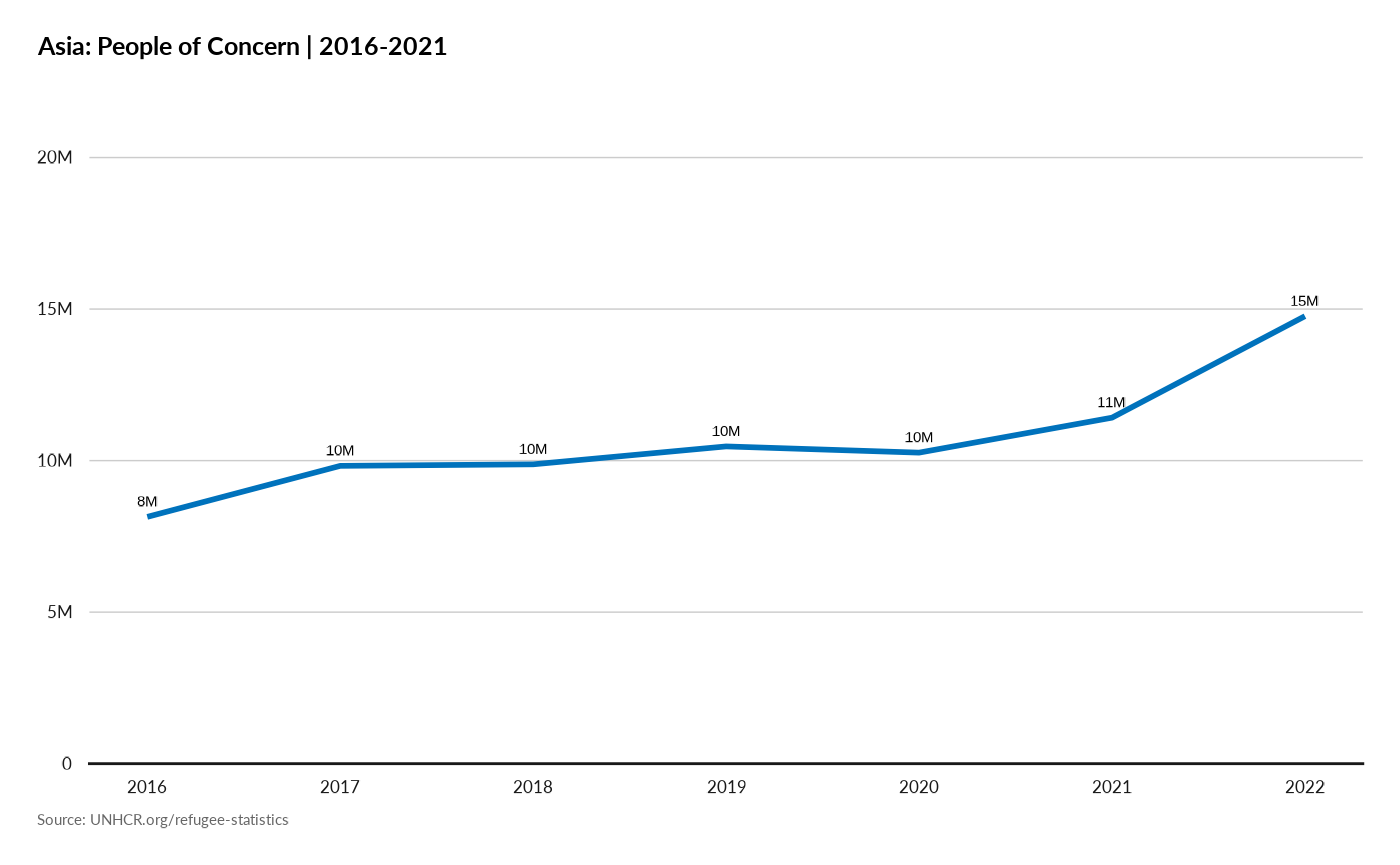
Plot Evolution of Population type per year
plot_reg_population_type_per_year(year = 2022,
                                              lag = 5,
                                     region  = "Americas",
                                     pop_type =   c("REF", "ASY", "IDP", "OIP", "STA", "OOC") )
#> Warning: The dot-dot notation (`..y..`) was deprecated in ggplot2 3.4.0.
#> ℹ Please use `after_stat(y)` instead.
#> ℹ The deprecated feature was likely used in the unhcrdatapackage package.
#>   Please report the issue at
#>   <https://github.com/edouard-legoupil/unhcrdatapackage/issues>.
#> This warning is displayed once every 8 hours.
#> Call `lifecycle::last_lifecycle_warnings()` to see where this warning was
#> generated.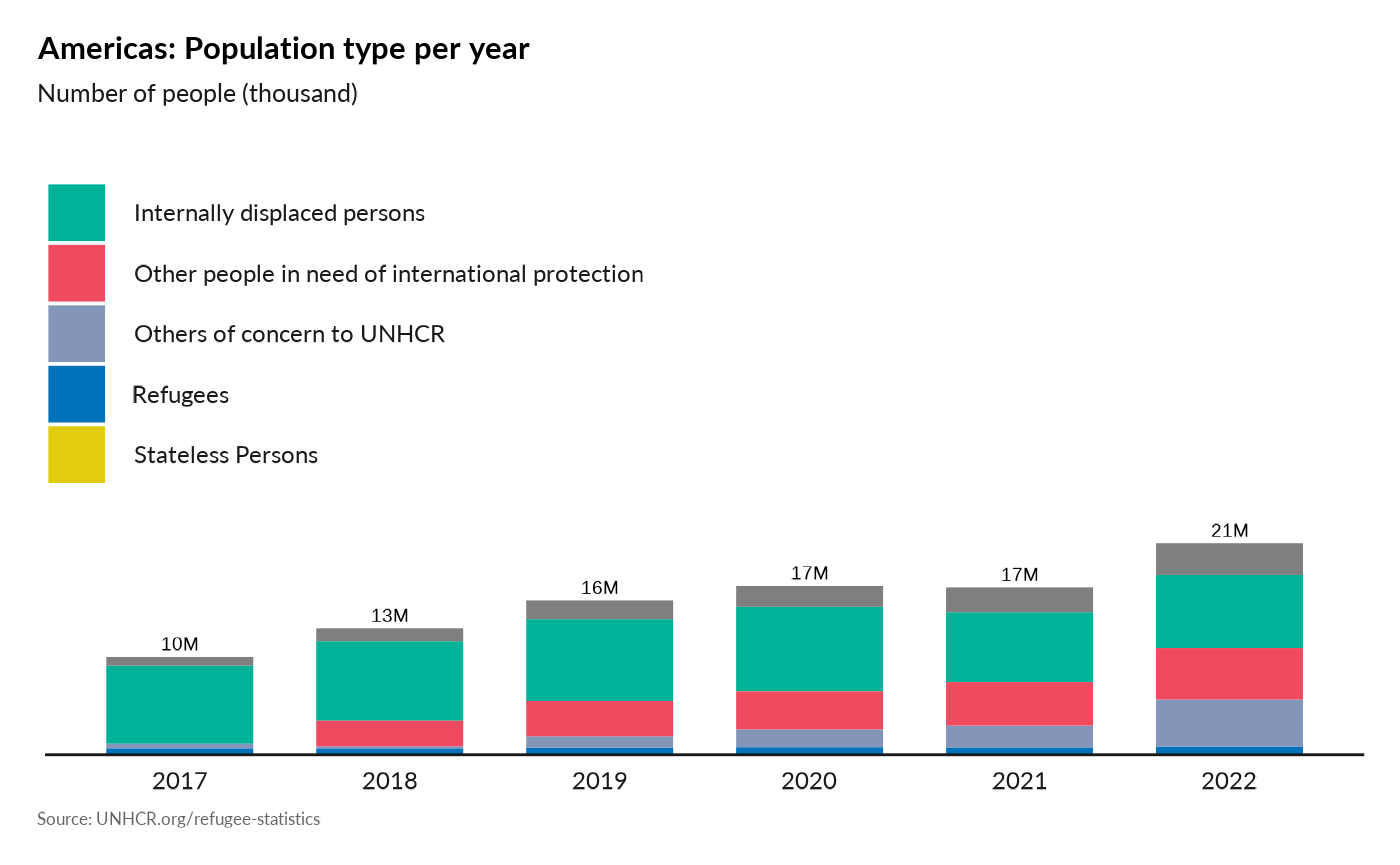
Plot Population Origin-Destination within the region
plot_reg_origin_dest(year = 2022, region = "Asia")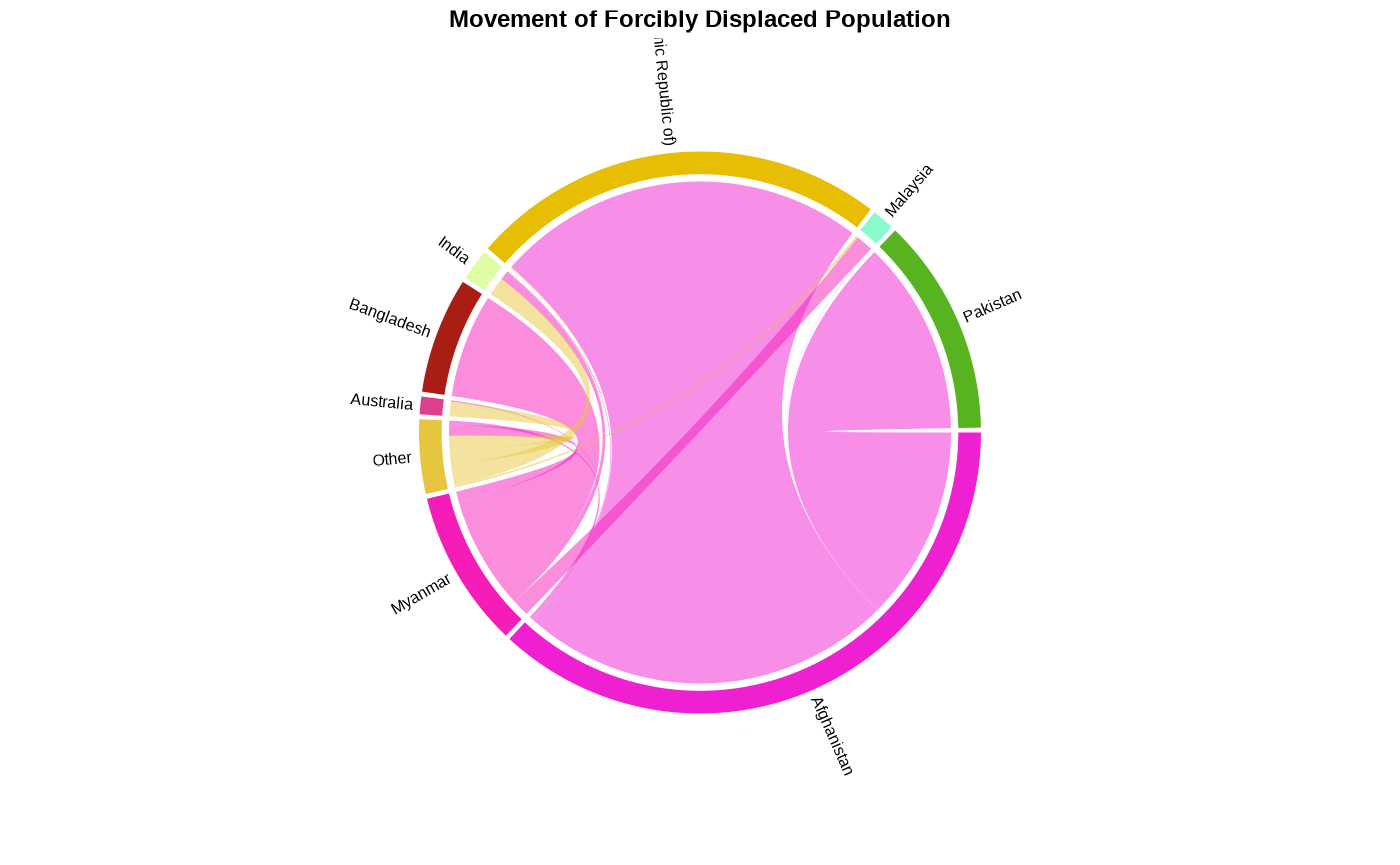
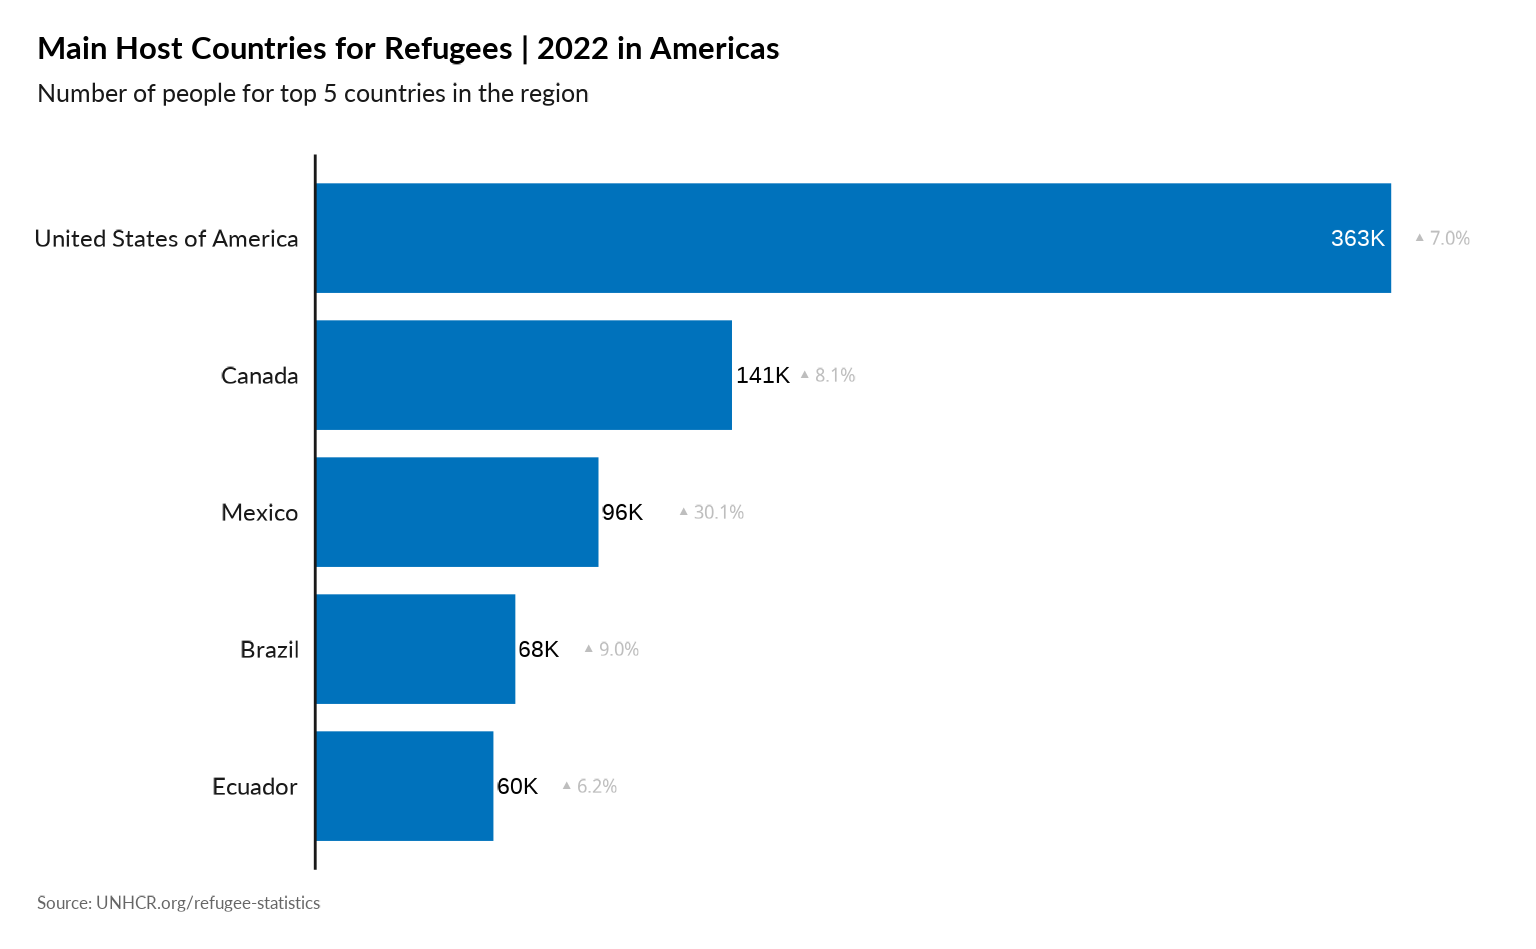
Plot Main country of Asylum in the Region
plot_reg_population_type_abs(year = 2022,
                              region = "Americas",
                              top_n_countries = 5,
                              pop_type = "REF",
                              show_diff_label = TRUE
                              )
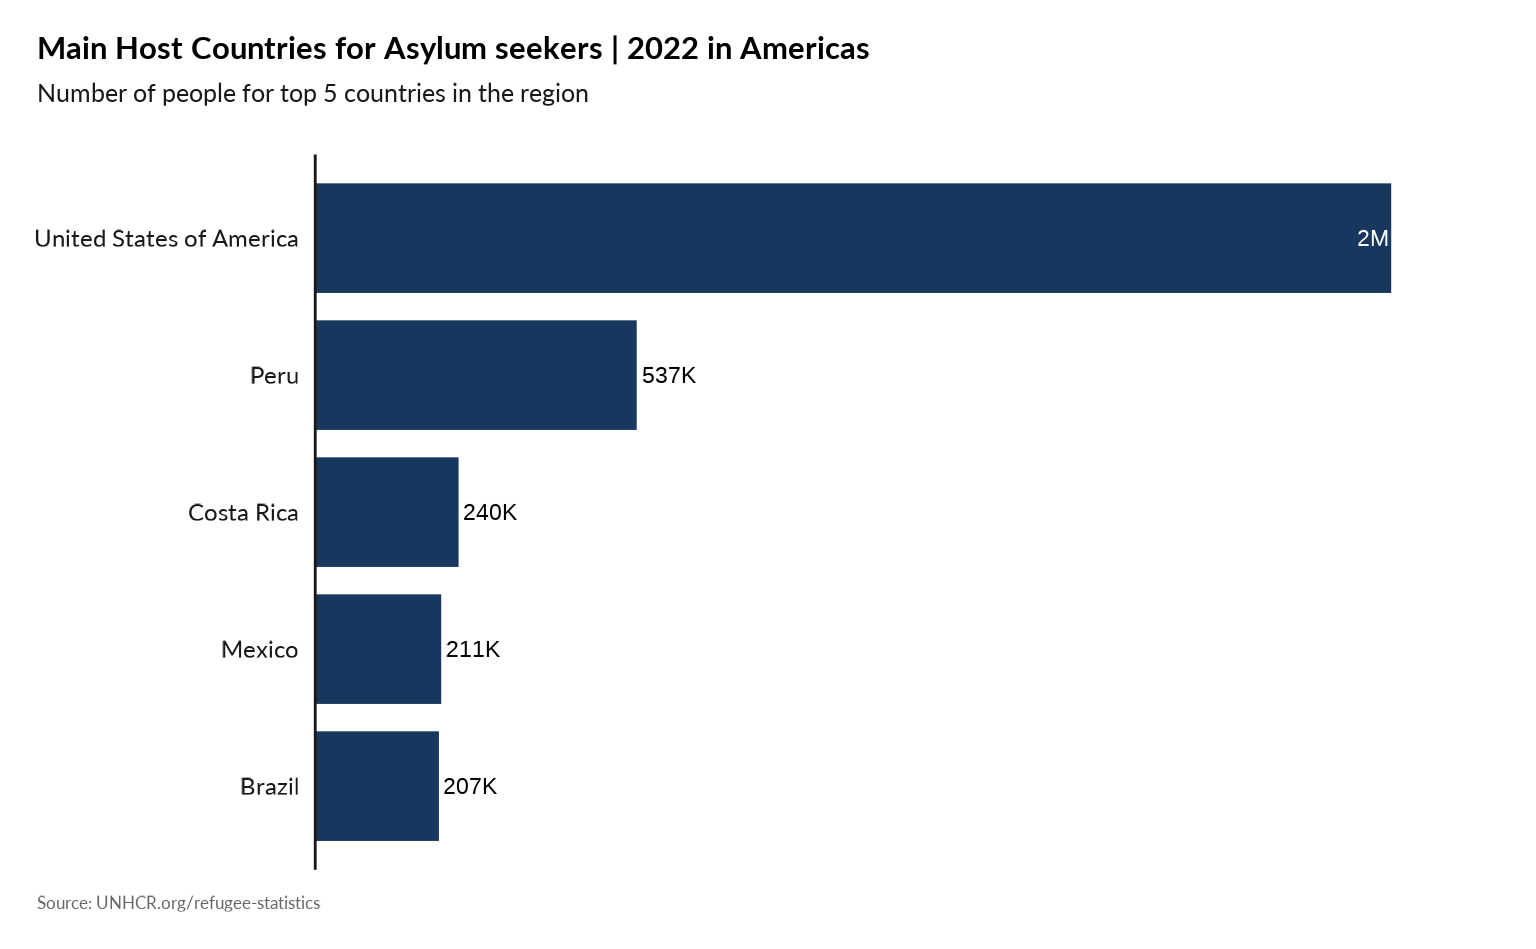
plot_reg_population_type_abs(year = 2022,
                              region = "Americas",
                              top_n_countries = 5,
                              pop_type = "ASY",
                              show_diff_label = FALSE
                              )
Plot Biggest decrease in Refugee Population
plot_reg_decrease(year = 2021,
                  lag = 5,
                  topn = 5,
                  region = "Americas",
                  pop_type = c("REF", "ASY", "OIP"))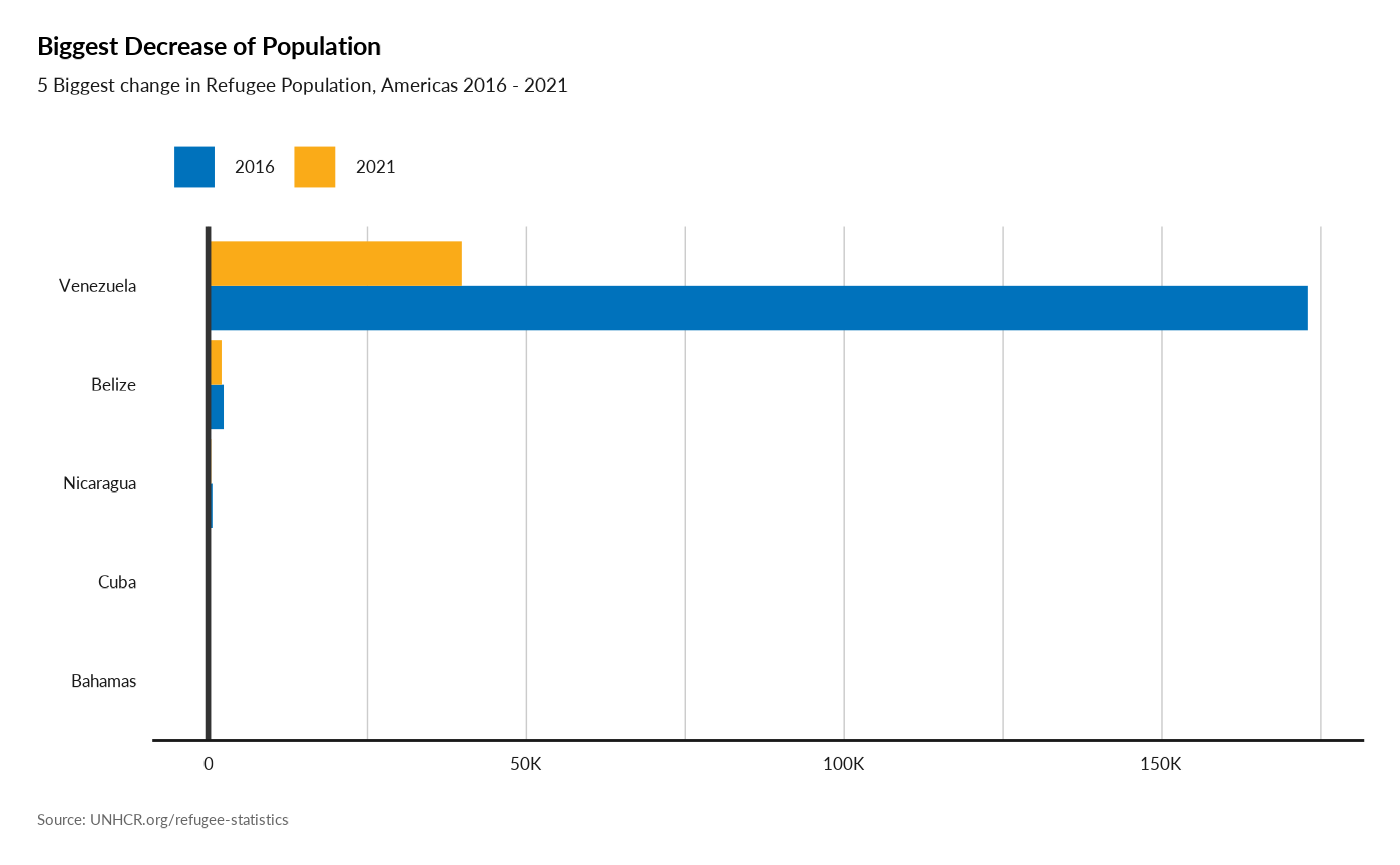
Plot Biggest increase in Refugee Population
plot_reg_increase(year = 2021,
                  lag = 5,
                  topn = 5,
                  region = "Americas",
                  pop_type = c("REF", "ASY", "OIP"))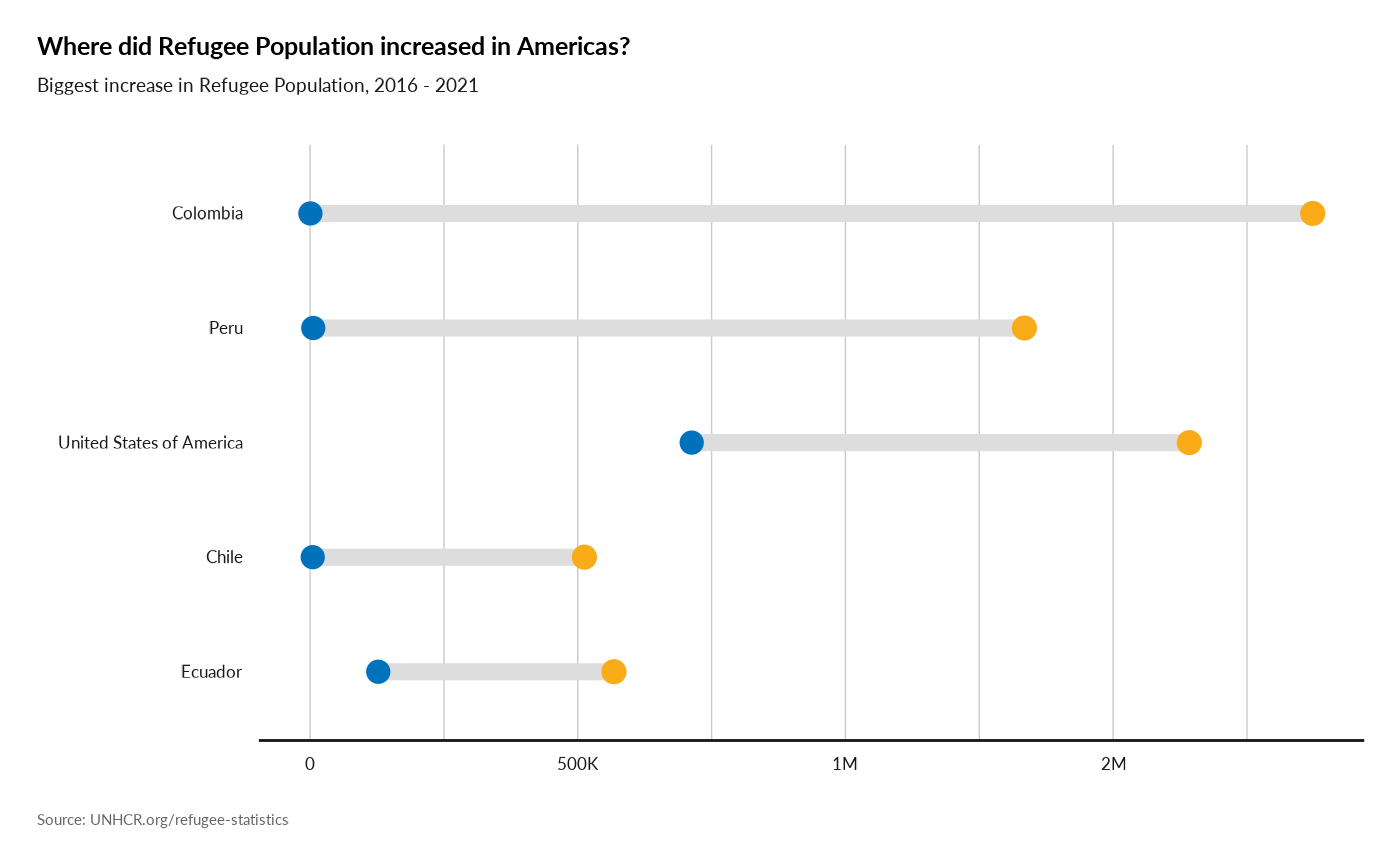
plot_reg_increase(year = 2021,
                  lag = 5,
                  topn = 5,
                  region = "Asia",
                  pop_type = c("REF", "ASY", "OIP"))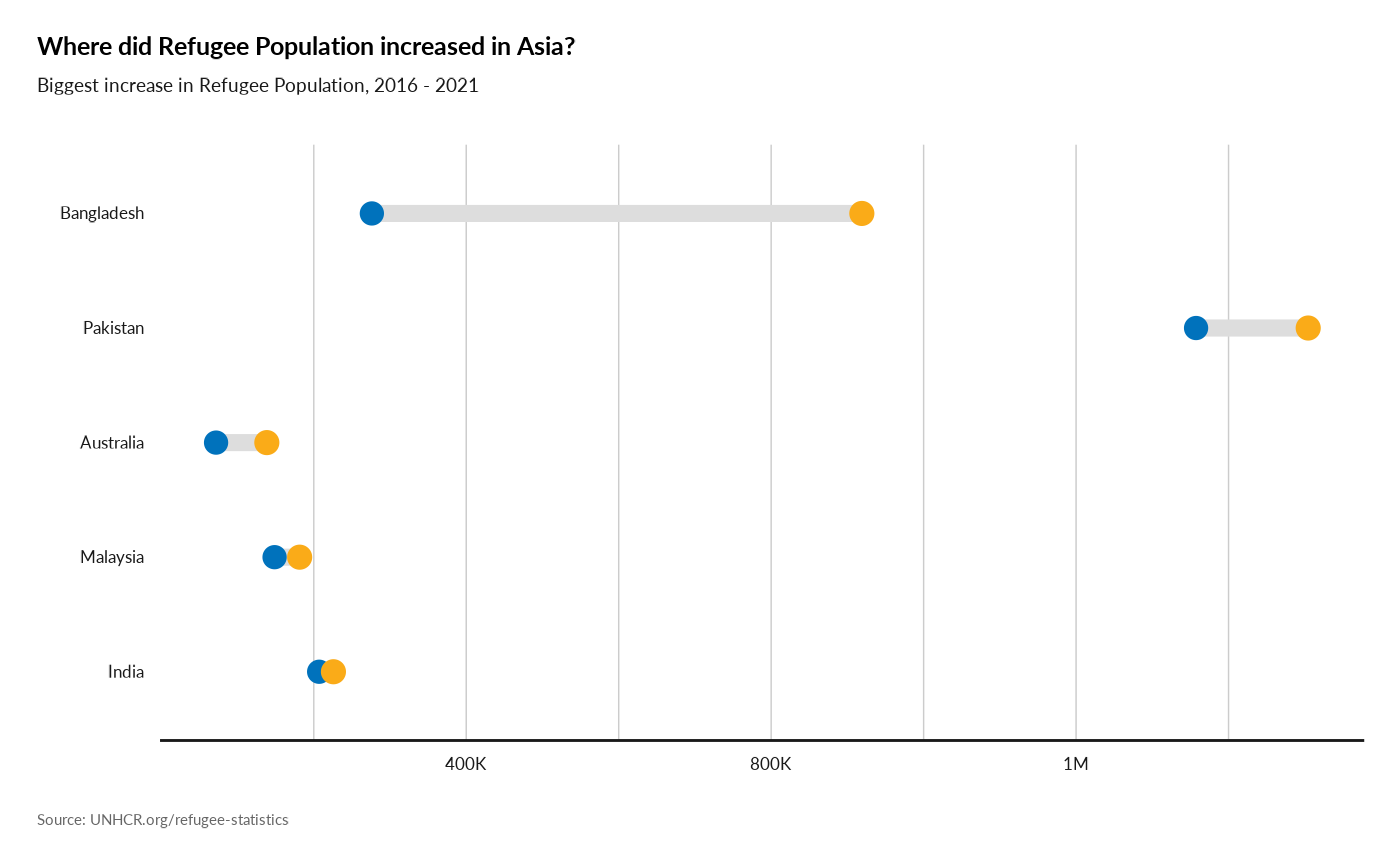
Proportion of the population who are refugees, by country of origin (SDG indicator 10.7.4 )
plot_reg_prop_origin(year = 2022, region = "Americas")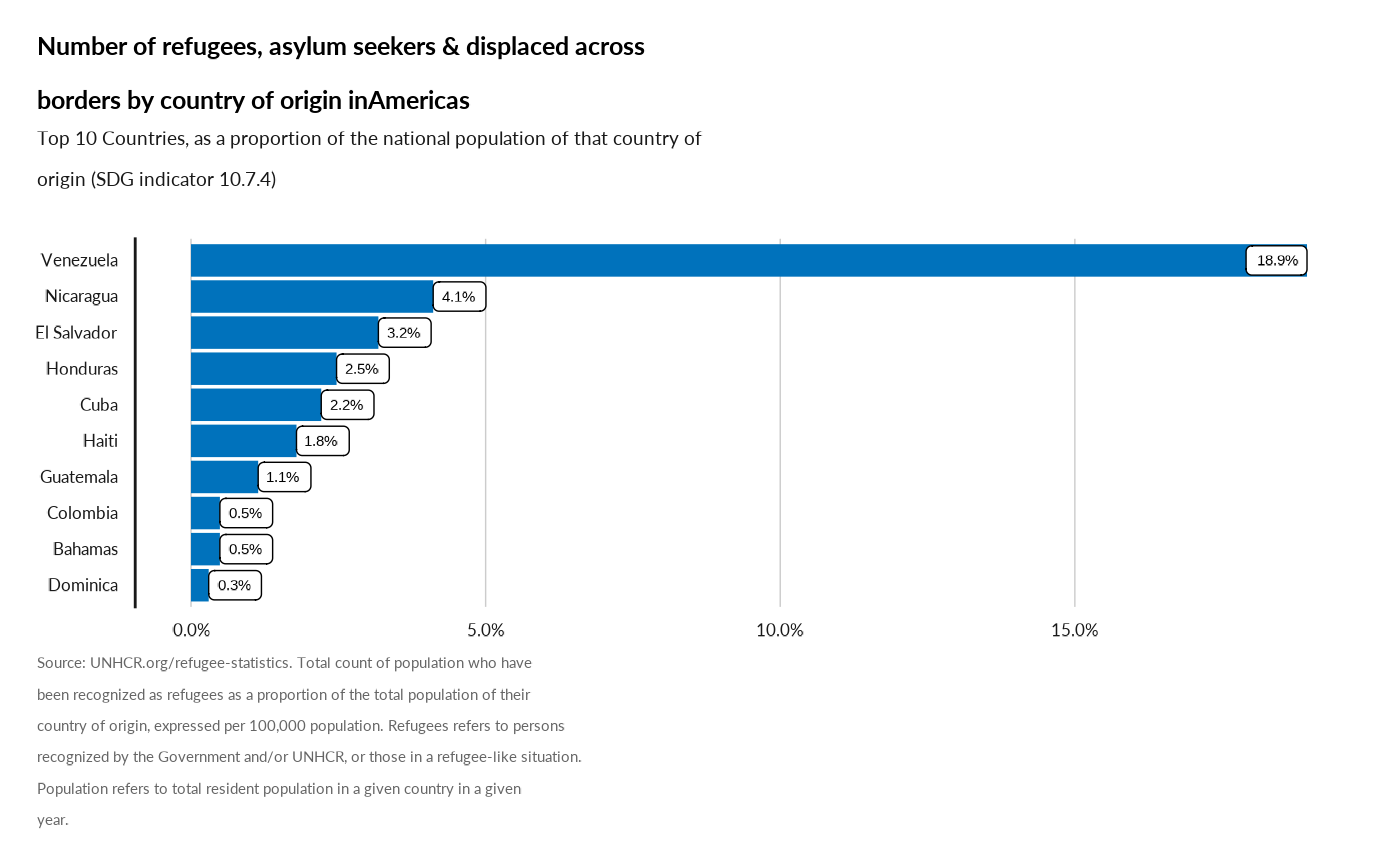
Decision on Refugee Status Determination
plot_reg_rsd(year = 2022,
             region = "Americas" ,
                        top_n_countries = 10,
                        measure = "Recognized")
#> Scale for y is already present.
#> Adding another scale for y, which will replace the existing scale.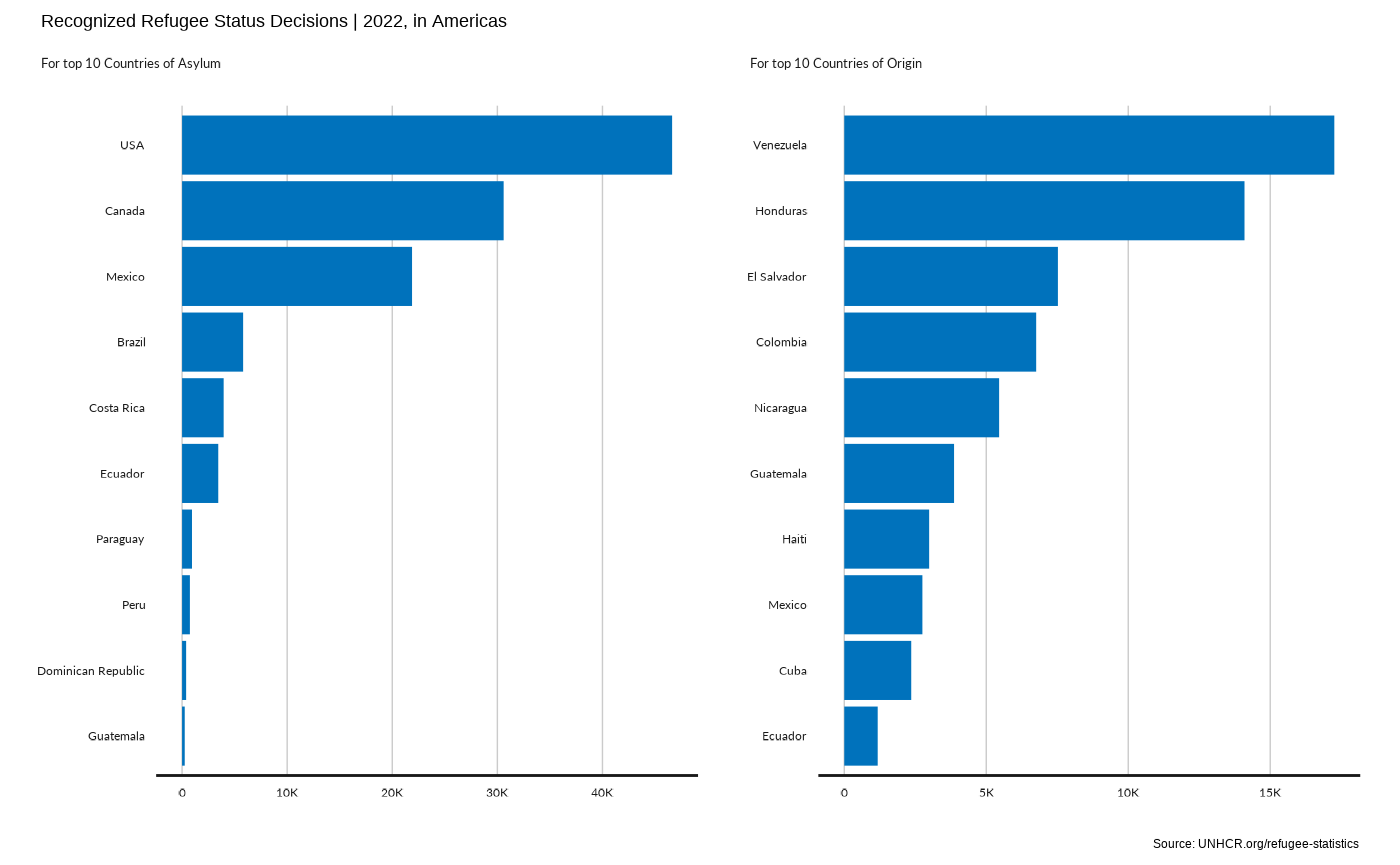
plot_reg_rsd(year = 2022,
             region = "Americas" ,
                        top_n_countries = 5,
                        measure = "ComplementaryProtection")
#> Scale for y is already present.
#> Adding another scale for y, which will replace the existing scale.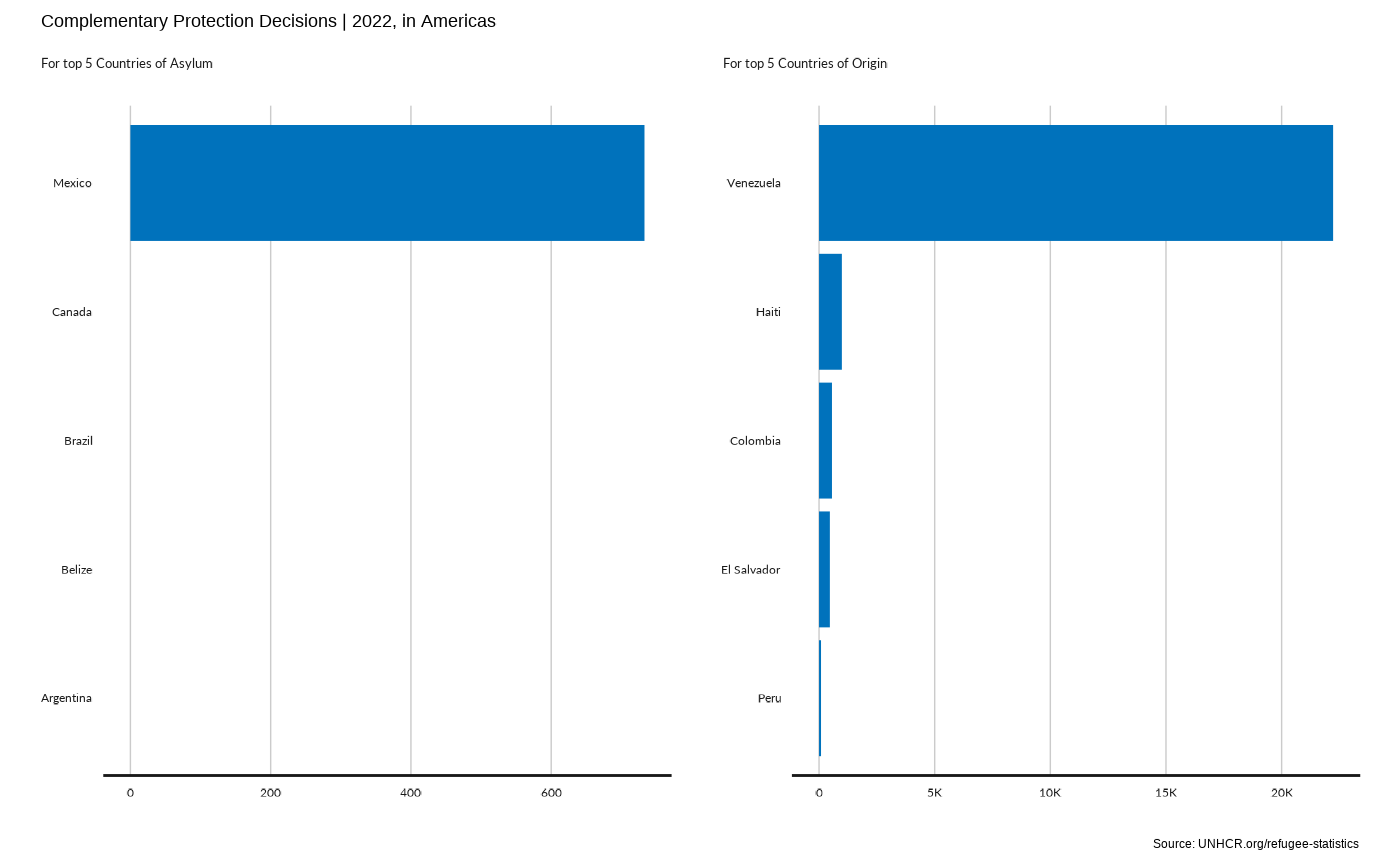
plot_reg_rsd(year = 2022,
             region = "Americas" ,
                        top_n_countries = 10,
                        measure = "TotalDecided")
#> Scale for y is already present.
#> Adding another scale for y, which will replace the existing scale.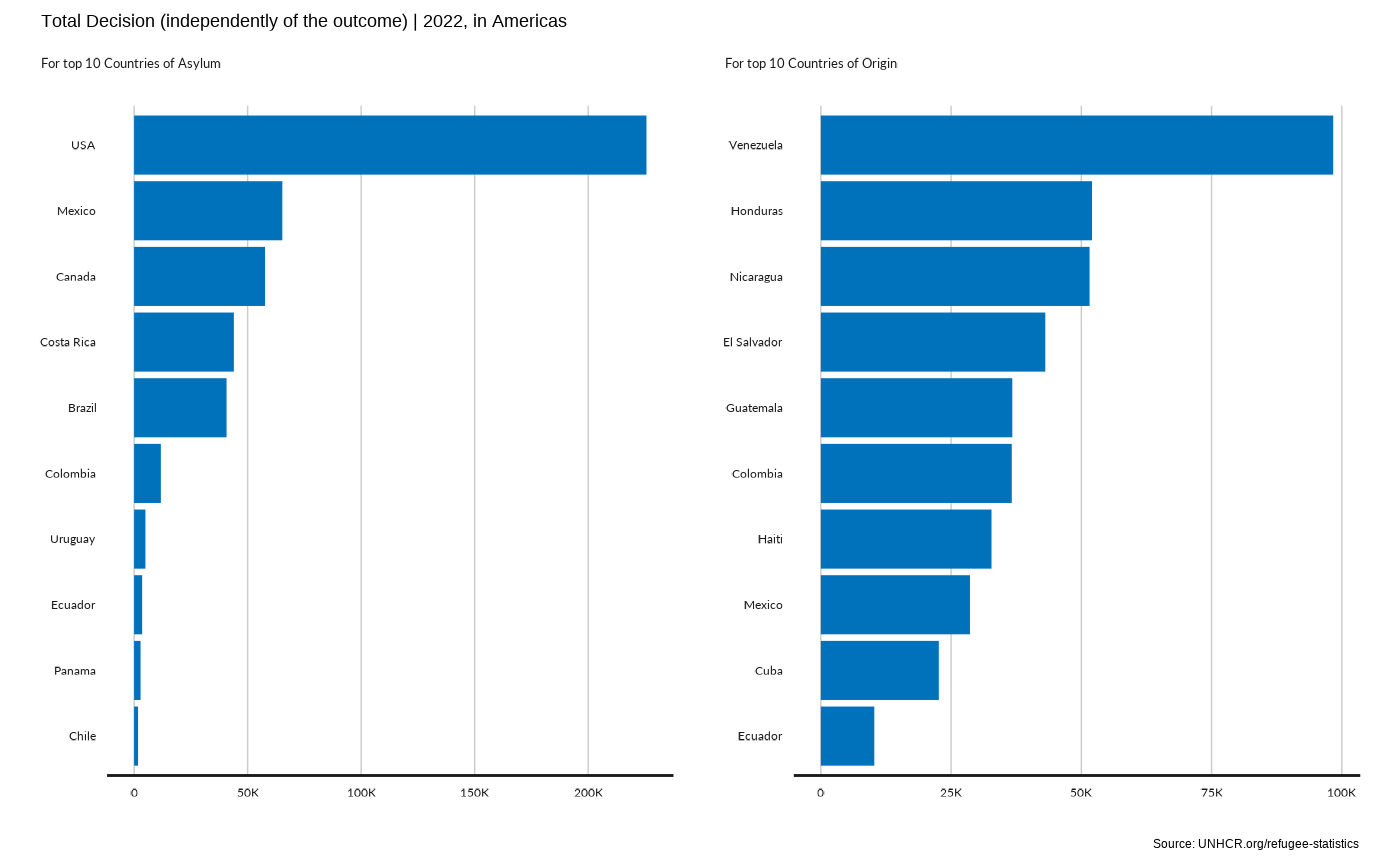
plot_reg_rsd(year = 2022,
             region = "Americas" ,
                        top_n_countries = 10,
                        measure = "RefugeeRecognitionRate")
#> Scale for y is already present.
#> Adding another scale for y, which will replace the existing scale.
plot_reg_rsd(year = 2022,
             region = "Americas" ,
                        top_n_countries = 10,
                        measure = "TotalRecognitionRate")
#> Scale for y is already present.
#> Adding another scale for y, which will replace the existing scale.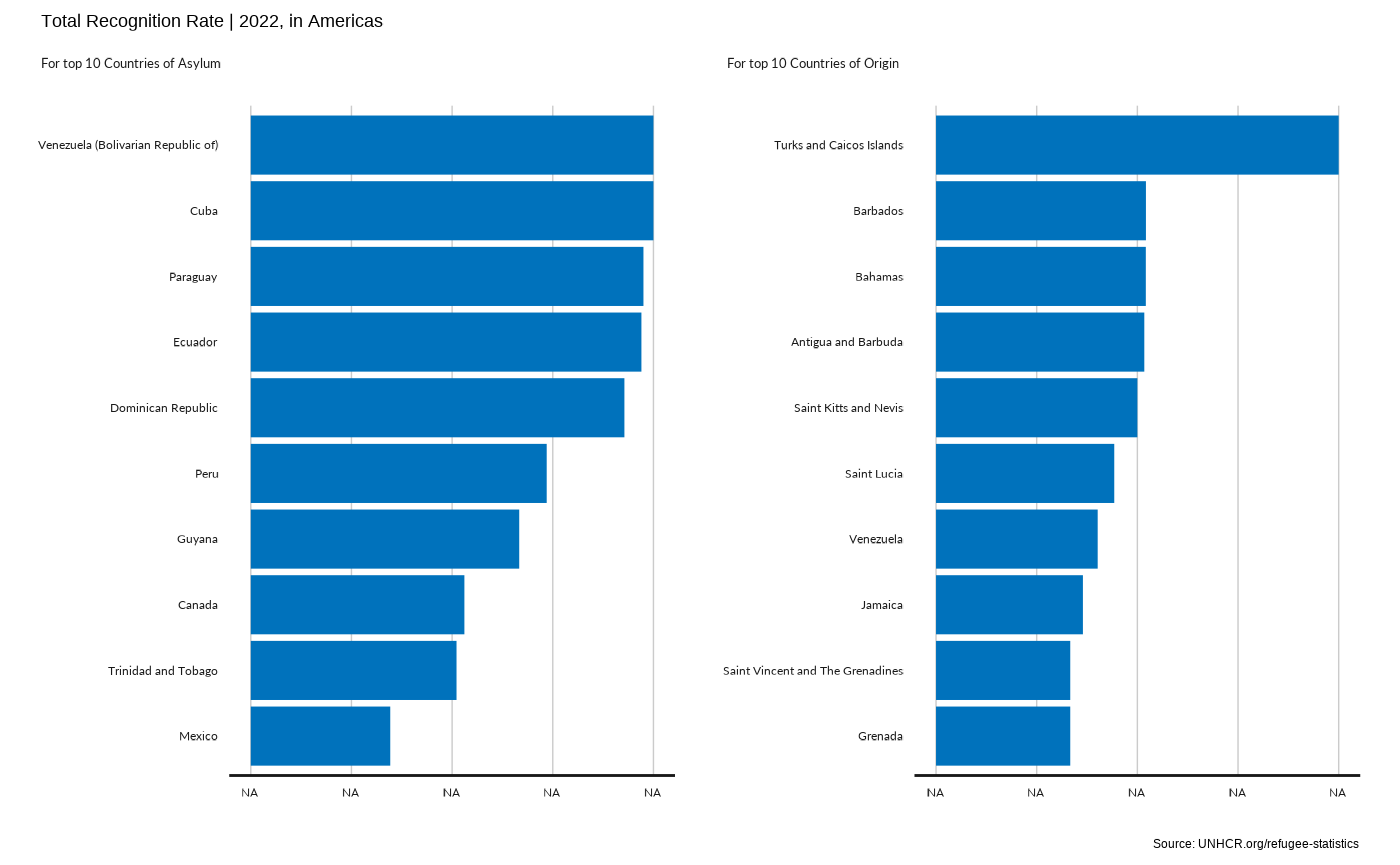
# plot_reg_rsd(year = 2022,
#              region = "Europe",
#                         top_n_countries = 10,
#                         measure = "Recognized")
Plot Evolution of Solutions in the Region
plot_reg_solution(year = 2022,
                            region = "Americas",
                            lag = 10)
#> `geom_smooth()` using formula = 'y ~ x'
#> Warning in simpleLoess(y, x, w, span, degree = degree, parametric = parametric,
#> : span too small.  fewer data values than degrees of freedom.
#> Warning in simpleLoess(y, x, w, span, degree = degree, parametric = parametric,
#> : pseudoinverse used at 2012
#> Warning in simpleLoess(y, x, w, span, degree = degree, parametric = parametric,
#> : neighborhood radius 1.05
#> Warning in simpleLoess(y, x, w, span, degree = degree, parametric = parametric,
#> : reciprocal condition number 0
#> Warning in simpleLoess(y, x, w, span, degree = degree, parametric = parametric,
#> : There are other near singularities as well. 1.1025
#> Warning in simpleLoess(y, x, w, span, degree = degree, parametric = parametric,
#> : span too small.  fewer data values than degrees of freedom.
#> Warning in simpleLoess(y, x, w, span, degree = degree, parametric = parametric,
#> : pseudoinverse used at 2012
#> Warning in simpleLoess(y, x, w, span, degree = degree, parametric = parametric,
#> : neighborhood radius 1.05
#> Warning in simpleLoess(y, x, w, span, degree = degree, parametric = parametric,
#> : reciprocal condition number 0
#> Warning in simpleLoess(y, x, w, span, degree = degree, parametric = parametric,
#> : There are other near singularities as well. 1.1025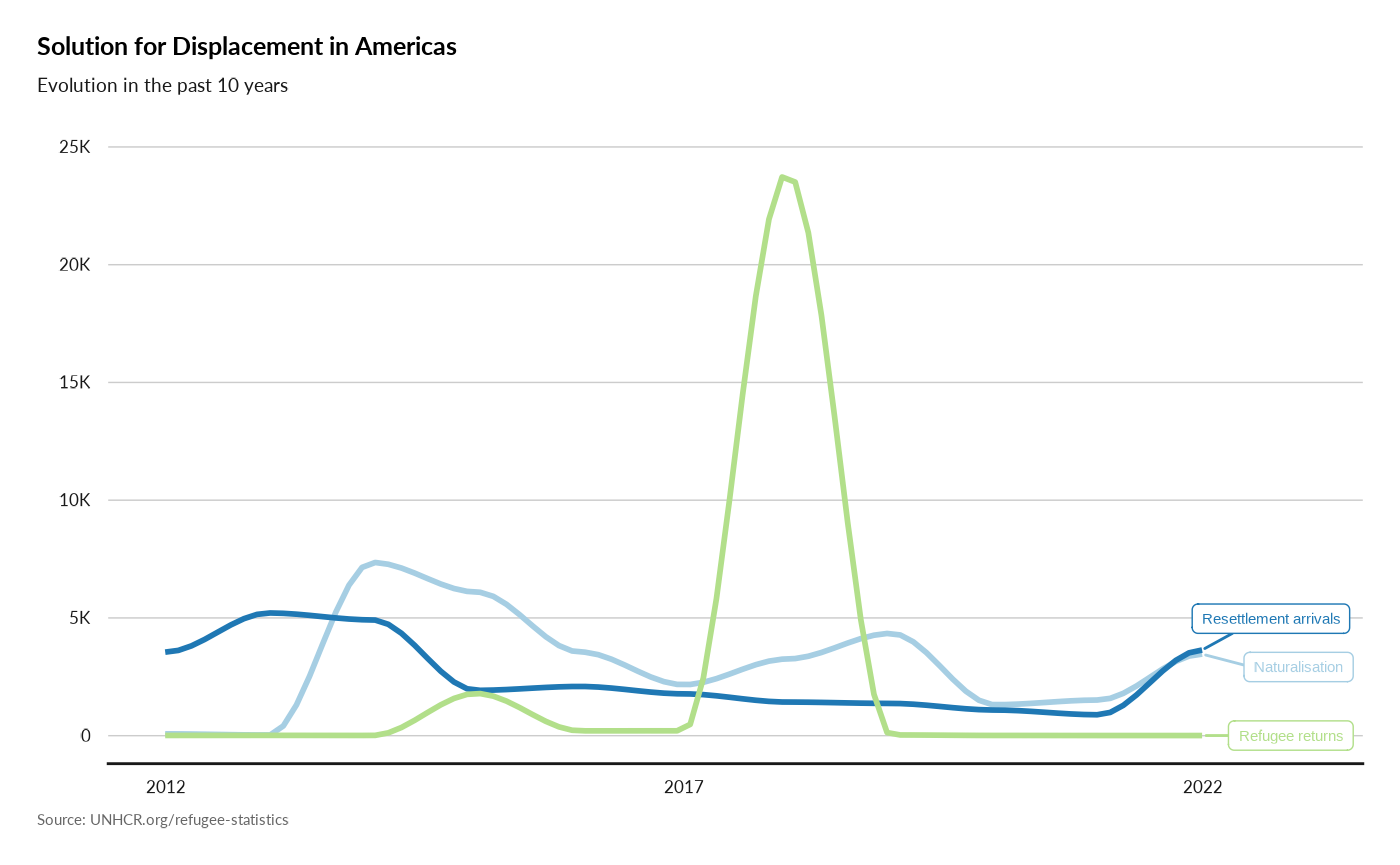
Mapping Population
plot_reg_map(  year = 2022,
                            region = "Asia",
                            topn = 5,
                            pop_type =  c("REF", "ASY", "OIP"),
                            projection = "Mercator",
                            maxSymbolsize = .25)
#> Warning in CPL_crs_from_input(x): GDAL Message 1: +init=epsg:XXXX syntax is
#> deprecated. It might return a CRS with a non-EPSG compliant axis order.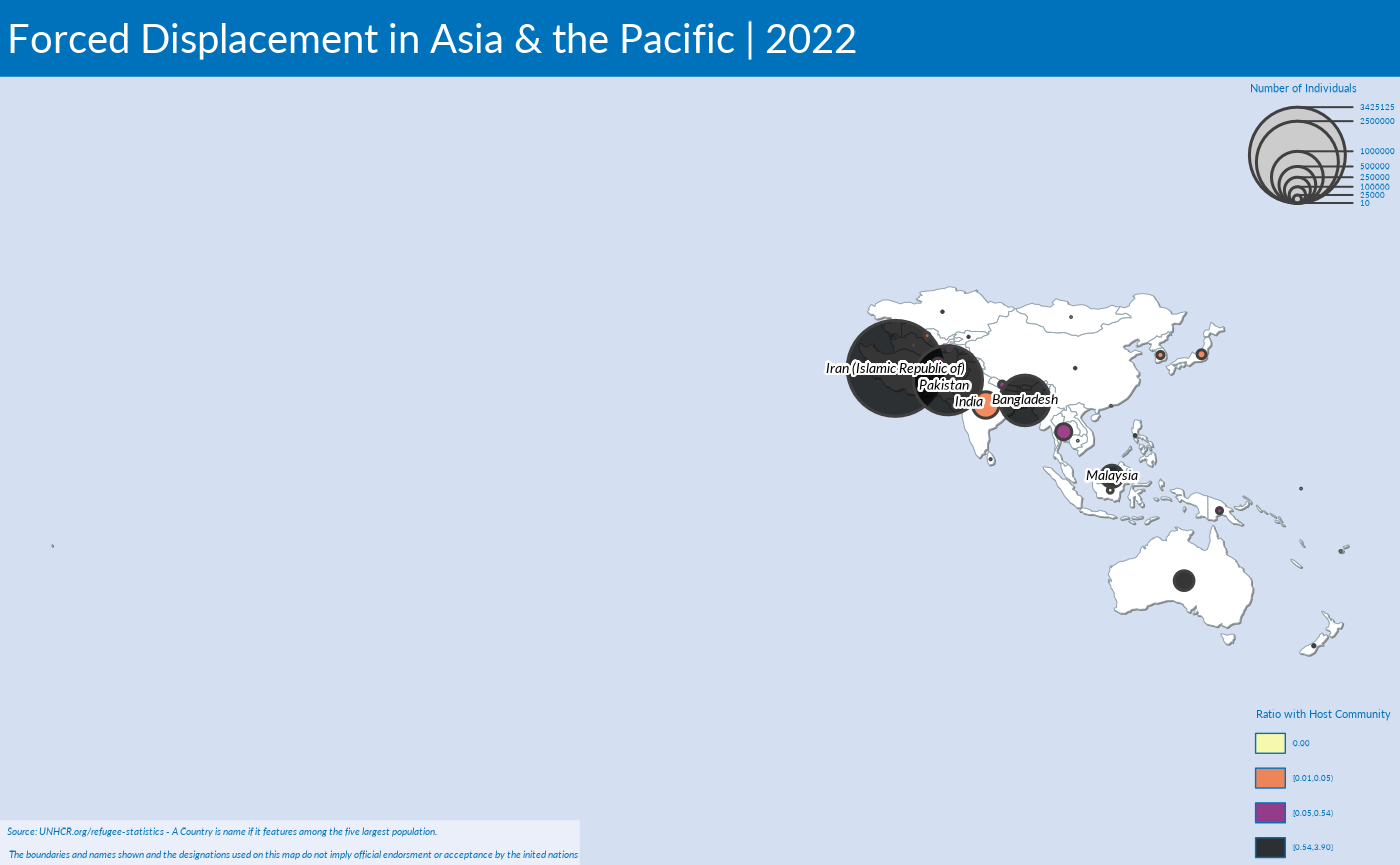
# plot_reg_map(  year = 2022,
#                             region = "WestAfrica",
#                             topn = 5,
#                             pop_type =  c("REF", "ASY", "OIP"),
#                             projection = "Mercator",
#                             maxSymbolsize = .25)