library(unhcrdatapackage)
#> Warning: replacing previous import 'shinydashboard::dashboardPage' by
#> 'shinydashboardPlus::dashboardPage' when loading 'unhcrdatapackage'
#> Warning: replacing previous import 'shinydashboard::dashboardSidebar' by
#> 'shinydashboardPlus::dashboardSidebar' when loading 'unhcrdatapackage'
#> Warning: replacing previous import 'shinydashboard::box' by
#> 'shinydashboardPlus::box' when loading 'unhcrdatapackage'
#> Warning: replacing previous import 'shinydashboard::dashboardHeader' by
#> 'shinydashboardPlus::dashboardHeader' when loading 'unhcrdatapackage'
#> Warning: replacing previous import 'shinydashboard::taskItem' by
#> 'shinydashboardPlus::taskItem' when loading 'unhcrdatapackage'
#> Warning: replacing previous import 'shinydashboard::notificationItem' by
#> 'shinydashboardPlus::notificationItem' when loading 'unhcrdatapackage'
#> Warning: replacing previous import 'shinydashboard::messageItem' by
#> 'shinydashboardPlus::messageItem' when loading 'unhcrdatapackage'
#> Registered S3 methods overwritten by 'ggalt':
#>   method                  from
#>   grid.draw.absoluteGrob  ggplot2
#>   grobHeight.absoluteGrob ggplot2
#>   grobWidth.absoluteGrob  ggplot2
#>   grobX.absoluteGrob      ggplot2
#>   grobY.absoluteGrob      ggplot2
#> Warning: replacing previous import 'shinydashboardPlus::box' by
#> 'shinydashboard::box' when loading 'unhcrdatapackage'
Below is the library with all Country Focused questions organised around the 7 key questions!
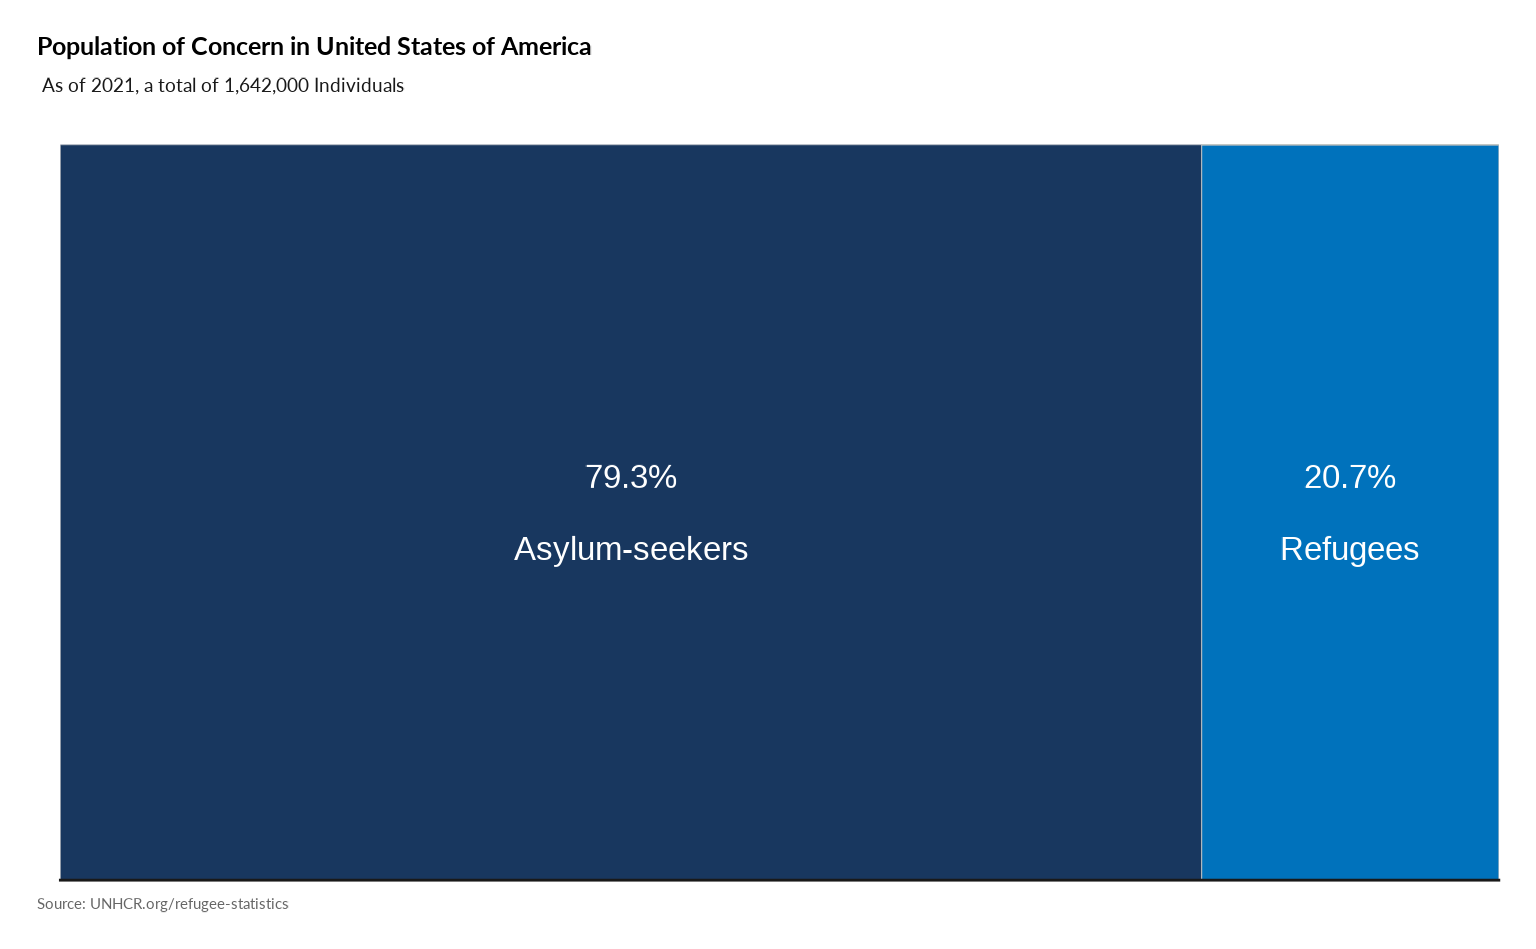
1. Category
Plot Tree Map of Categories
#
plot_ctr_treemap(year = 2021,
                            country_asylum_iso3c = "USA",
                            pop_type = c("REF", "ASY")
         )
Plot Population Type Over Year
p <- plot_ctr_population_type_per_year(
                         year = 2022,
                         country_asylum_iso3c = "PAN",
                         lag = 5,
                         pop_type = c("REF",
                                       "ASY",
                                       "OIP",
                                       "OOC",
                                       "STA",
                                       "IDP" )
                  )
p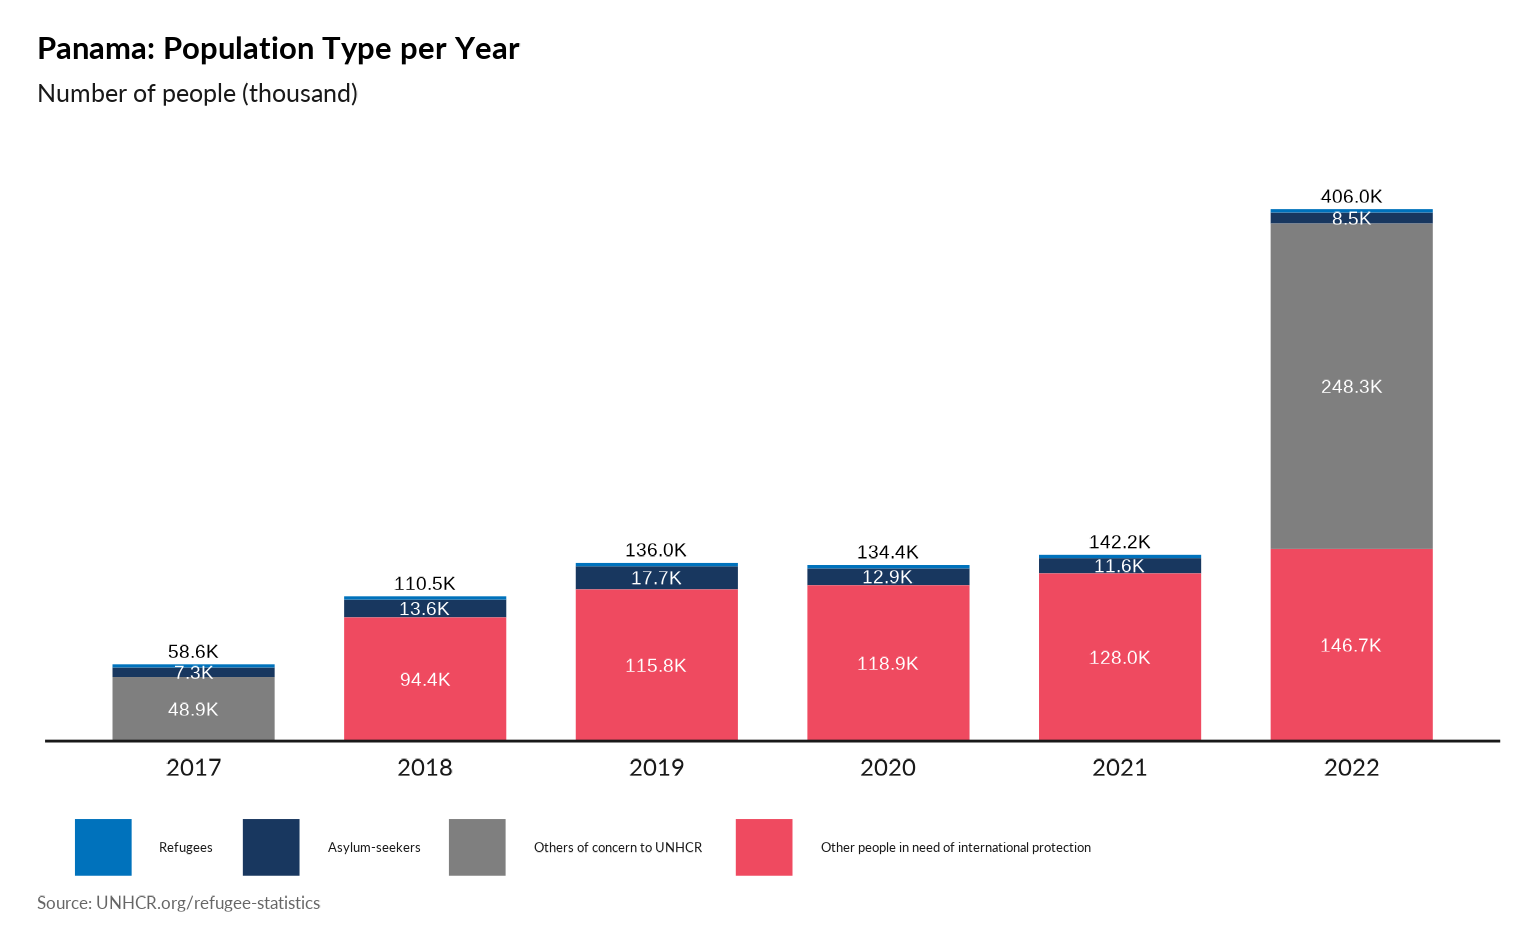
## Raw data can always be accessed with
#knitr::kable(ggplot2::ggplot_build(p)$plot$data )
2. Origin
Plot Main country of origin in one specific country - Absolute value
plot_ctr_population_type_abs(year = 2020,
                    country_asylum_iso3c = "USA",
                    top_n_countries = 4,
                    pop_type = "REF",
                    show_diff_label = FALSE
                    )
#> Warning: There was 1 warning in `mutate()`.
#> ℹ In argument: `origin_data_prot = forcats::fct_explicit_na(origin_data_prot,
#>   "Other nationalities")`.
#> Caused by warning:
#> ! `fct_explicit_na()` was deprecated in forcats 1.0.0.
#> ℹ Please use `fct_na_value_to_level()` instead.
#> ℹ The deprecated feature was likely used in the unhcrdatapackage package.
#>   Please report the issue at
#>   <https://github.com/edouard-legoupil/unhcrdatapackage/issues>.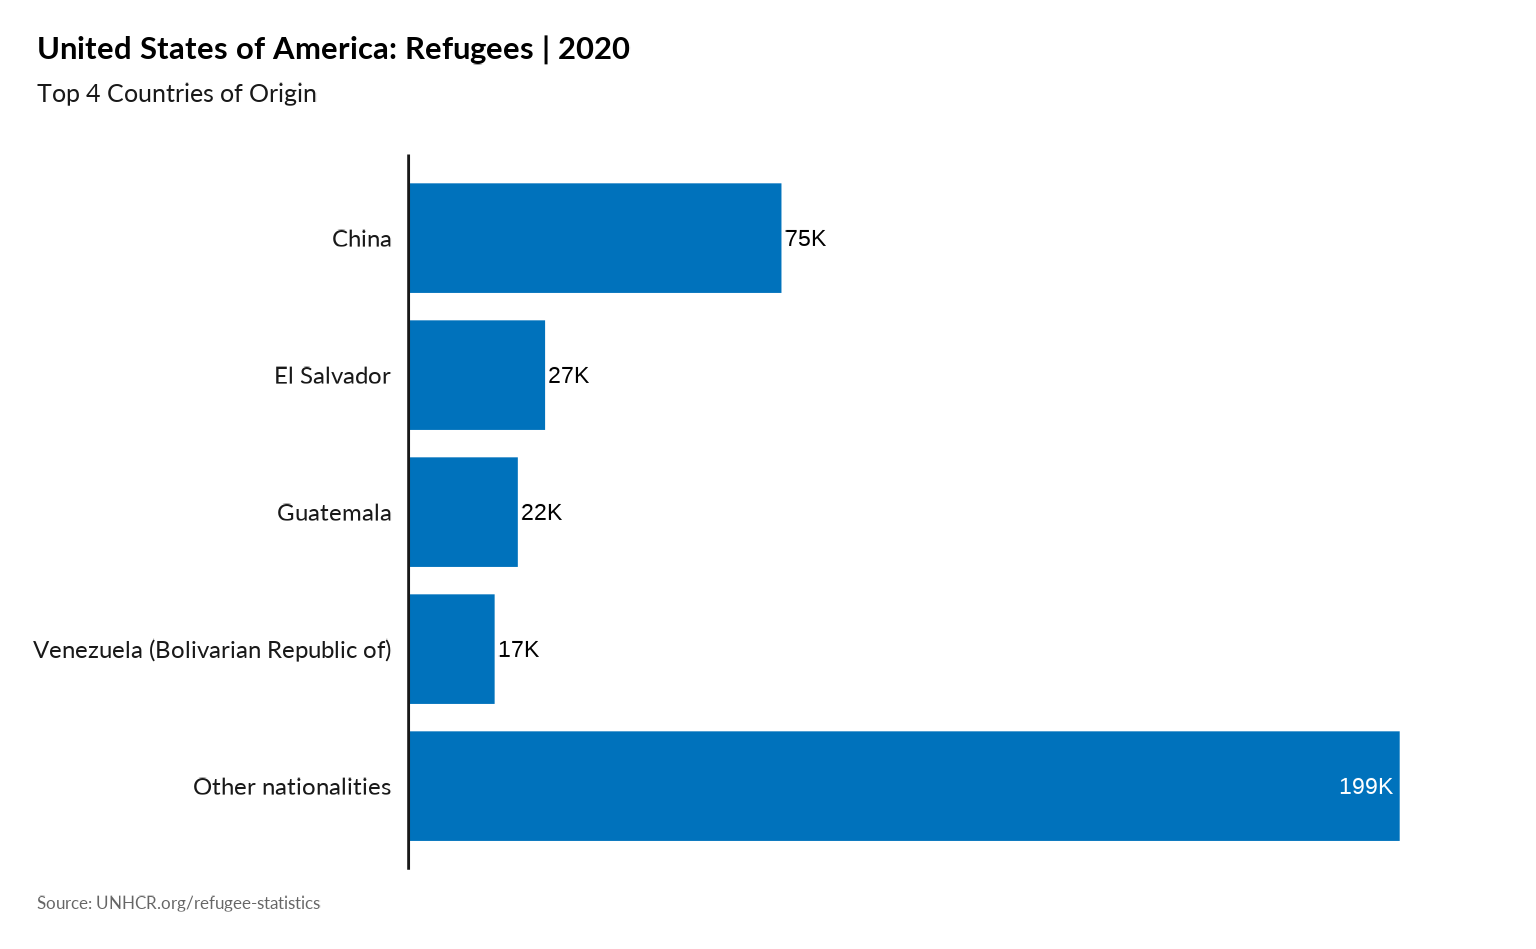
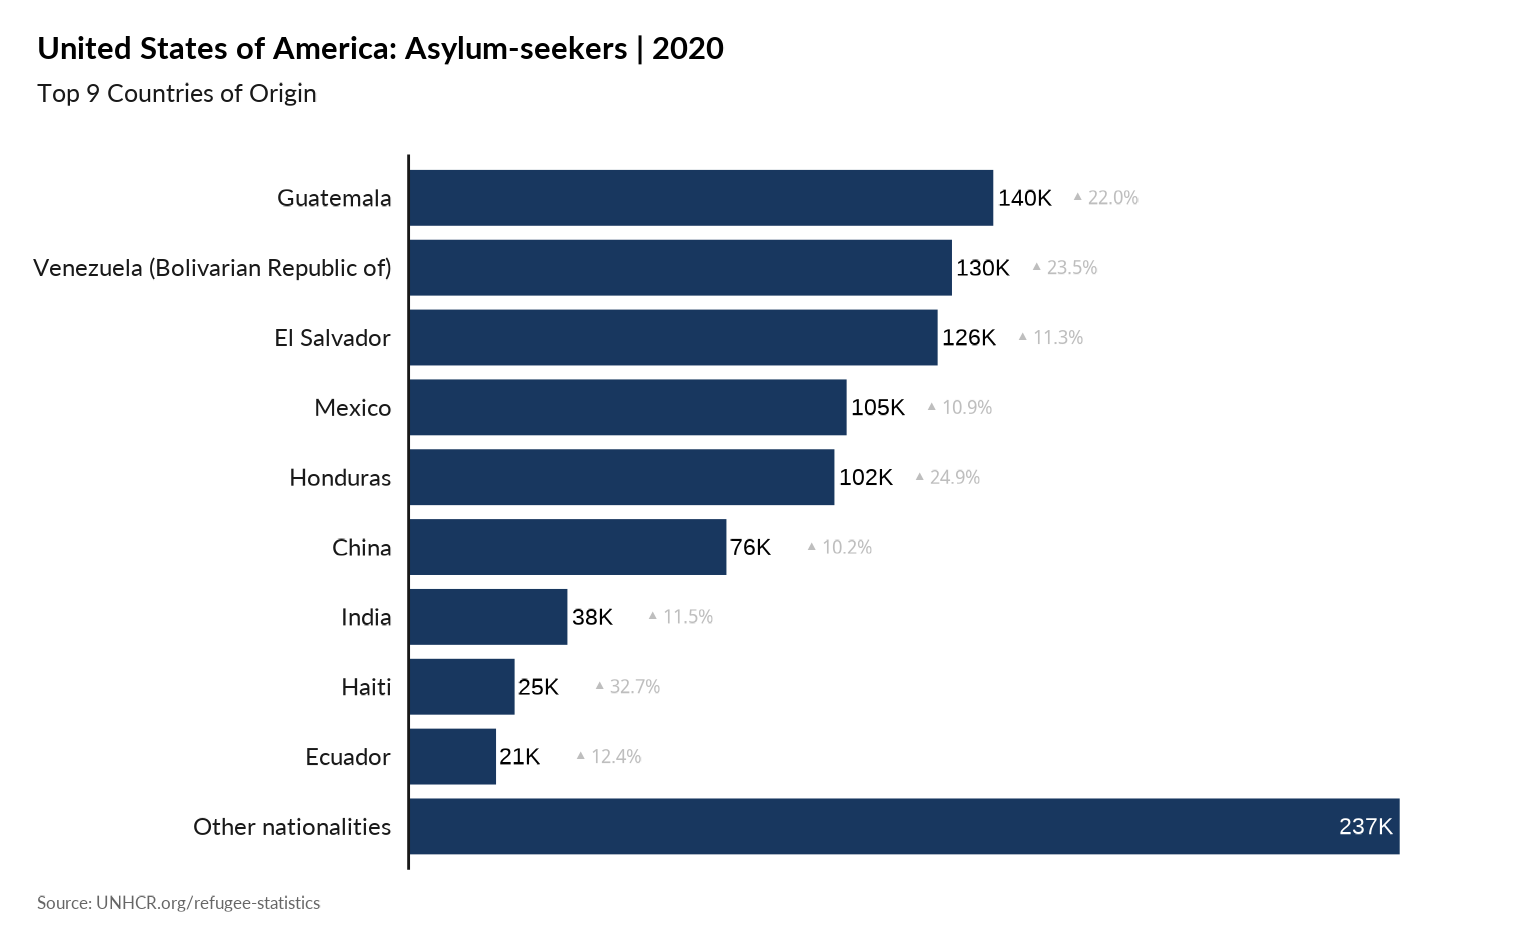
## Same with 9 top countries and Asylum-seekers included
plot_ctr_population_type_abs(year = 2020,
                    country_asylum_iso3c = "USA",
                    top_n_countries = 9,
                    pop_type = "ASY",
                    show_diff_label = TRUE
) 
Plot Main country of origin in one specific country - Percentage
plot_ctr_population_type_perc(year = 2021,
                    country_asylum_iso3c = "BRA",
                    top_n_countries = 9,
pop_type = "REF" ) 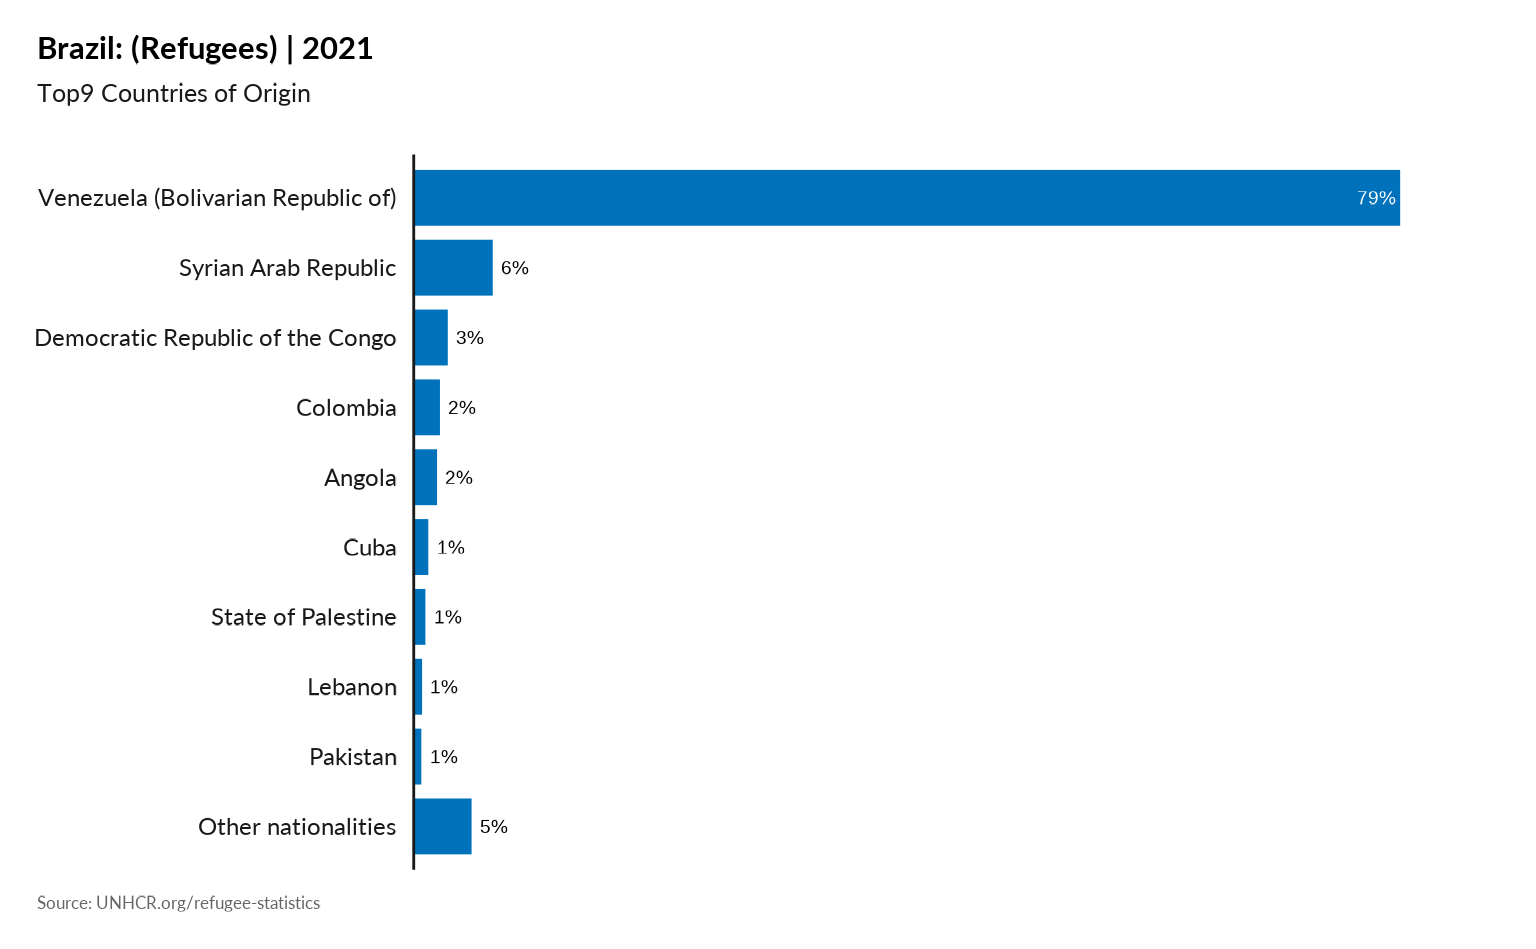
plot_ctr_population_type_perc(year = 2021,
                    country_asylum_iso3c = "BRA",
                    top_n_countries = 9,
pop_type = "ASY" ) 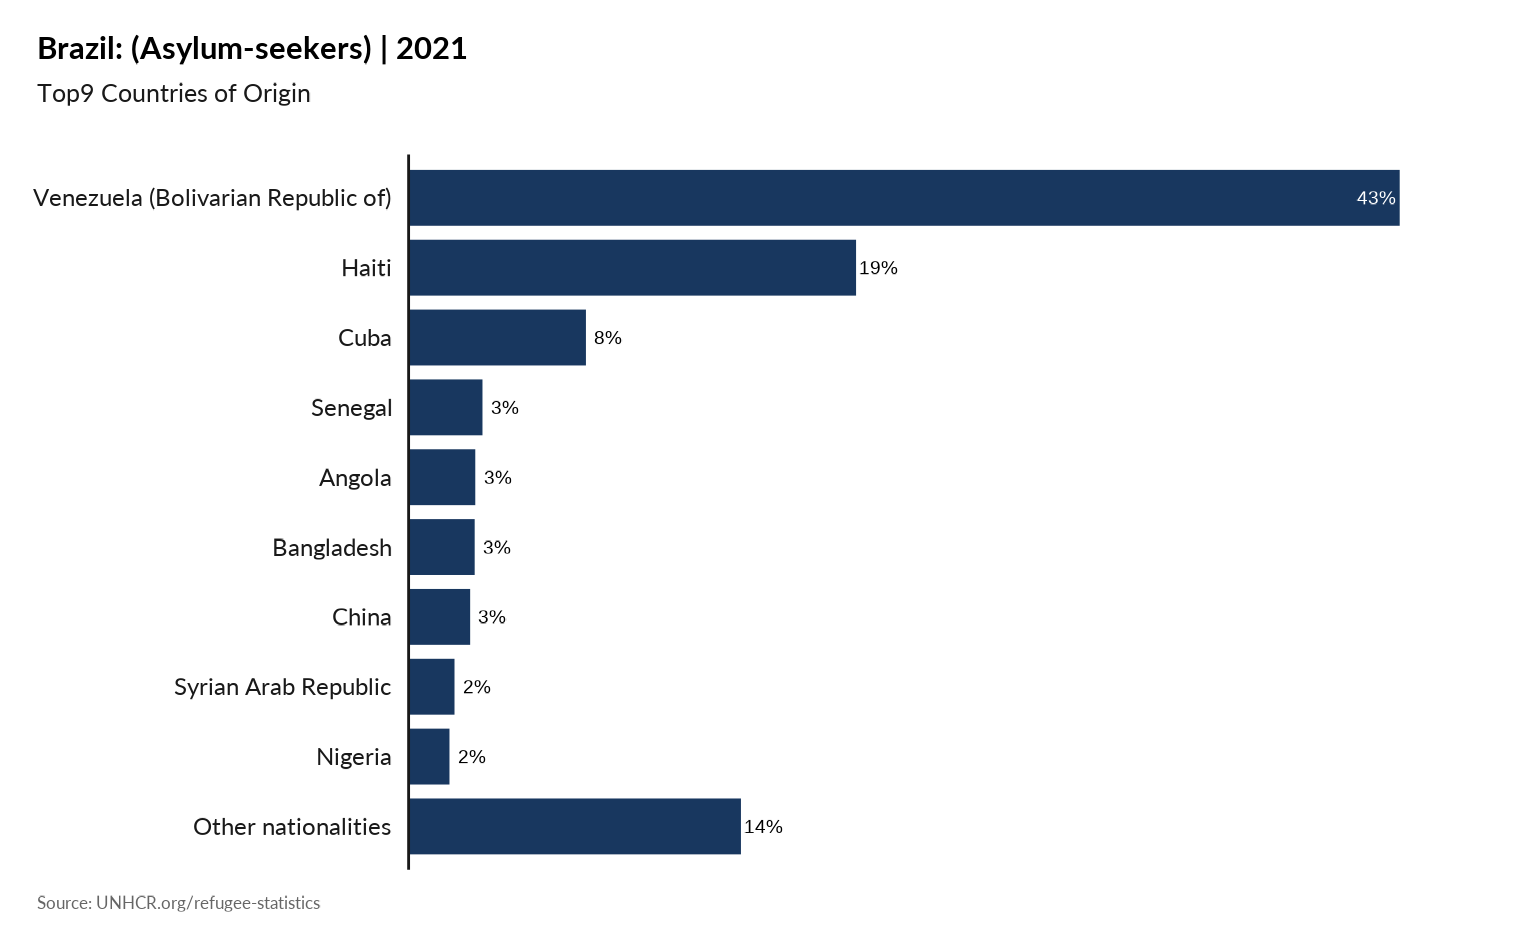
Plot Increases and Decreases in Population Groups
#
plot_ctr_diff_in_pop_groups(year = 2022,
                            country_asylum_iso3c = "ROU",
                            pop_type = c("REF", "ASY")
         )
#> Warning: Returning more (or less) than 1 row per `summarise()` group was deprecated in
#> dplyr 1.1.0.
#> ℹ Please use `reframe()` instead.
#> ℹ When switching from `summarise()` to `reframe()`, remember that `reframe()`
#>   always returns an ungrouped data frame and adjust accordingly.
#> ℹ The deprecated feature was likely used in the unhcrdatapackage package.
#>   Please report the issue at
#>   <https://github.com/edouard-legoupil/unhcrdatapackage/issues>.
#> This warning is displayed once every 8 hours.
#> Call `lifecycle::last_lifecycle_warnings()` to see where this warning was
#> generated.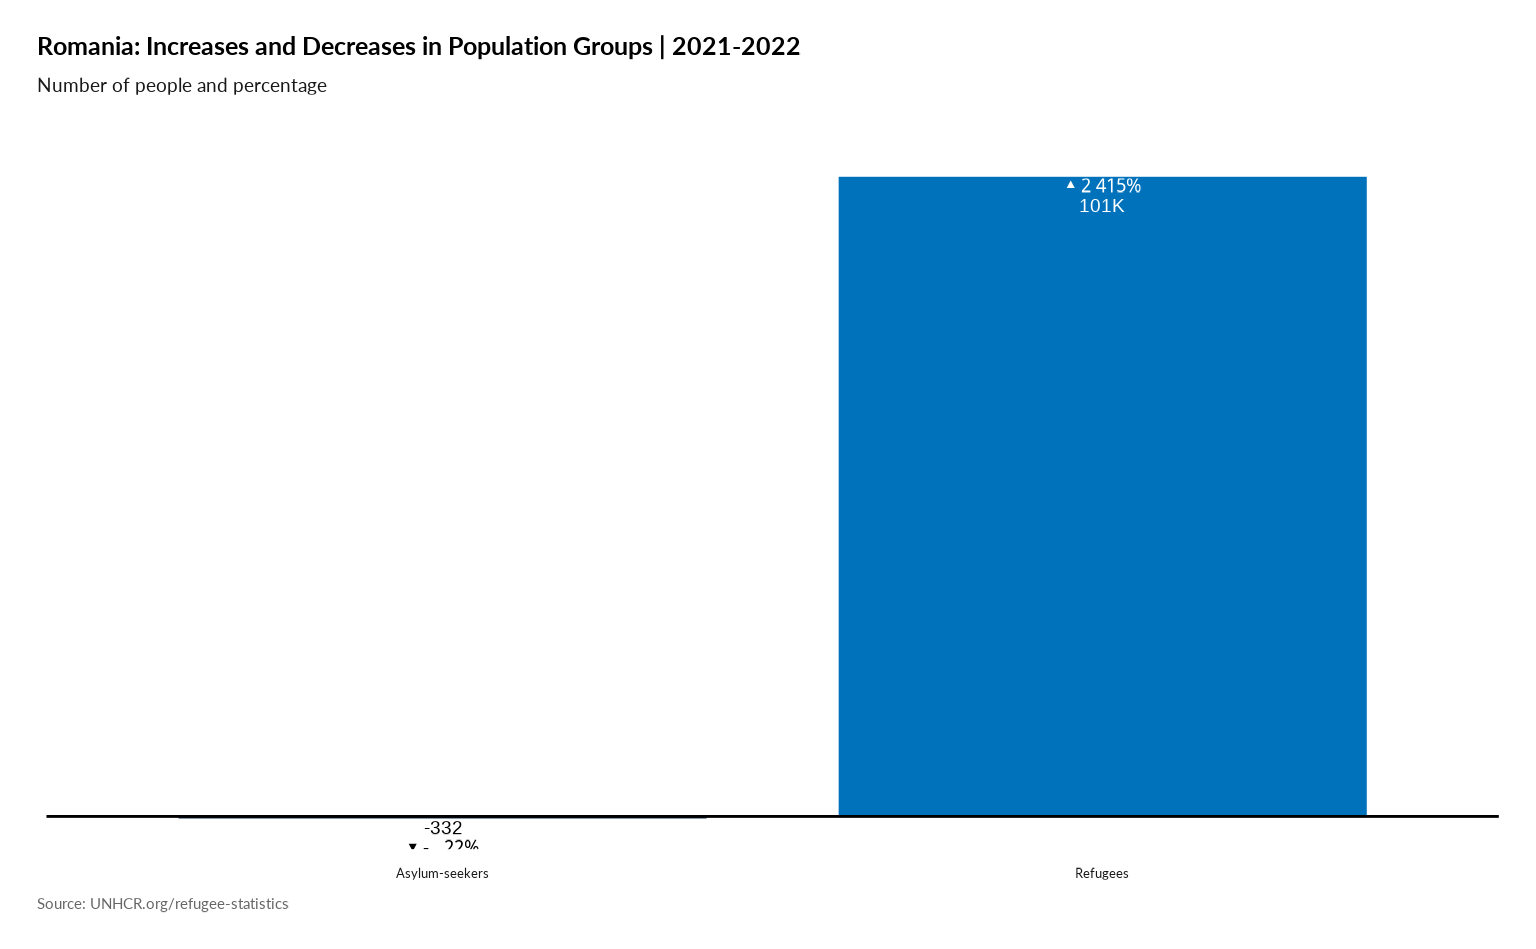
Plot Origin History
plot_ctr_origin_history(year = 2022,
                        lag = 5,
                        country_asylum_iso3c = "MEX",
                          pop_type = c("REF",
                                       "ASY",
                                       "OIP",
                                       "IDP" ),
                        otherprop = .02)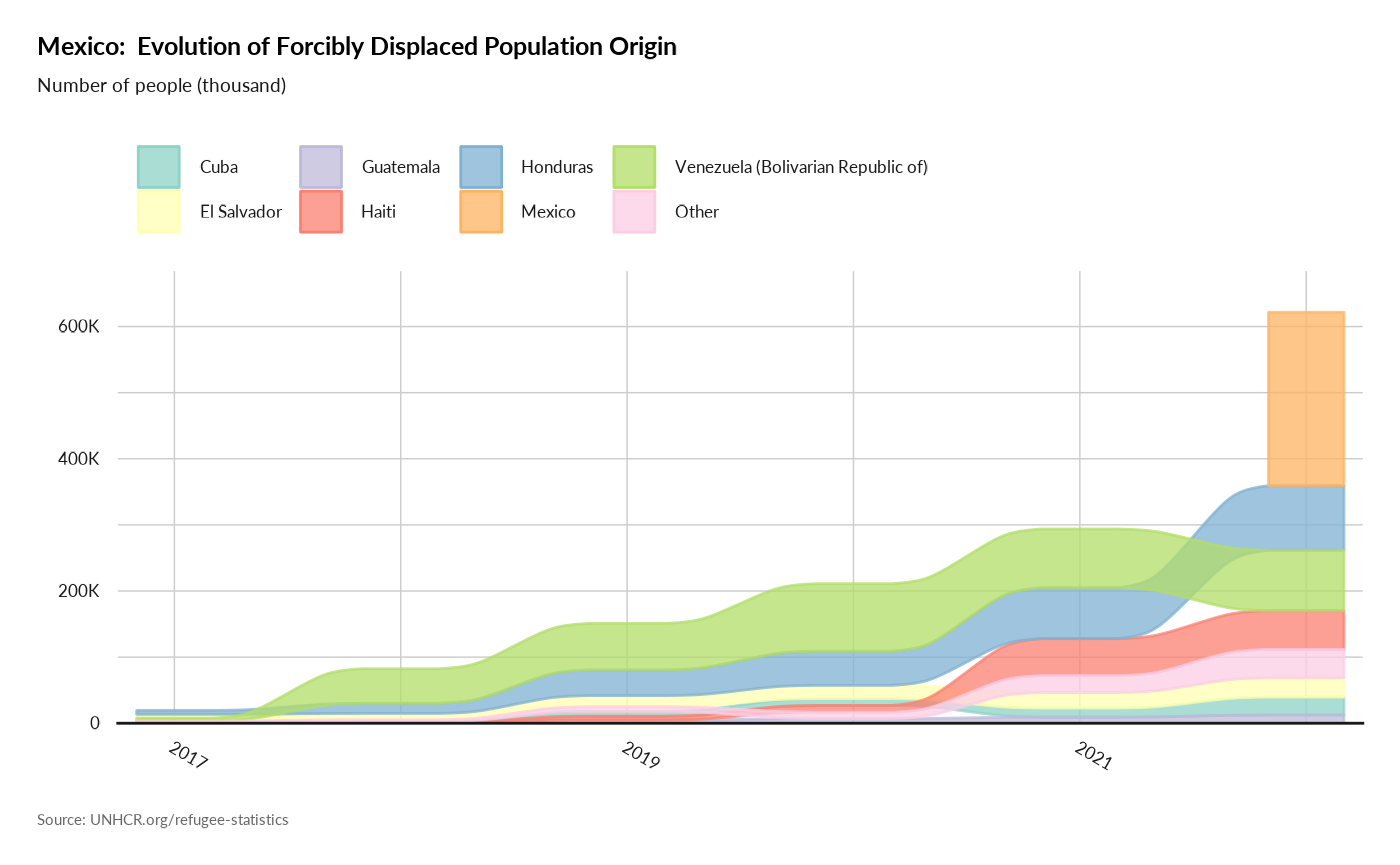
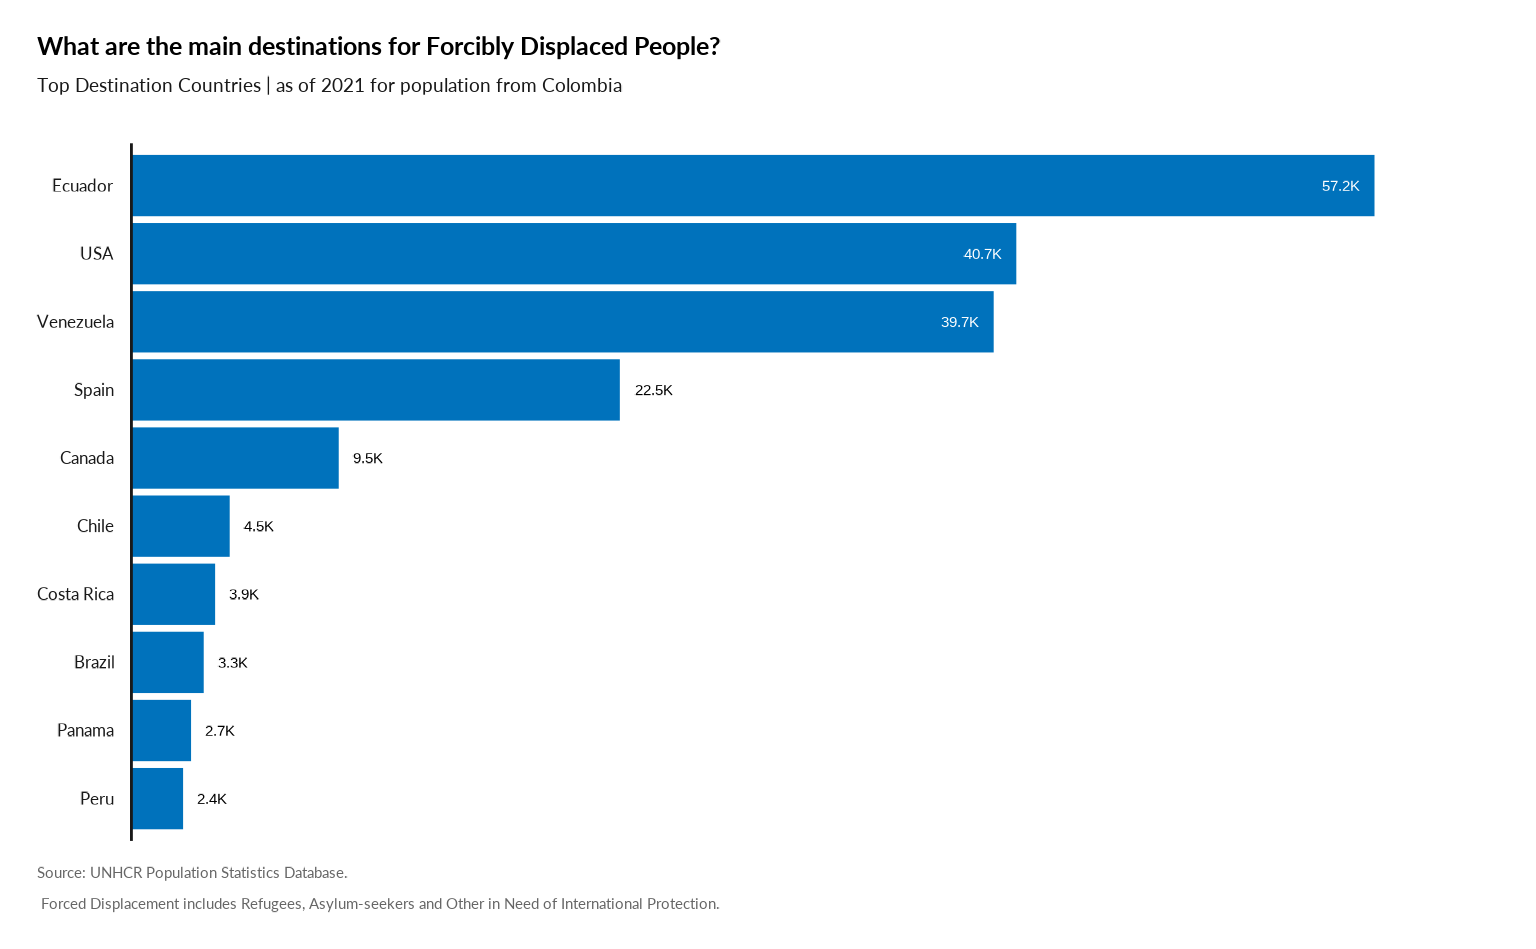
3. Destination
Plot Main Destination from one specific country
#
plot_ctr_destination(year = 2021,
                     country_origin_iso3c = "COL",
                     pop_type = c("REF", "ASY")
         )
plot recognition rate for a nationality
plot_ctr_origin_recognition(year = 2022,
                     country_origin_iso3c = "VEN",
                     top_n_countries = 10,
                     measure = "RefugeeRecognitionRate",
                     order_by = "TotalDecided" )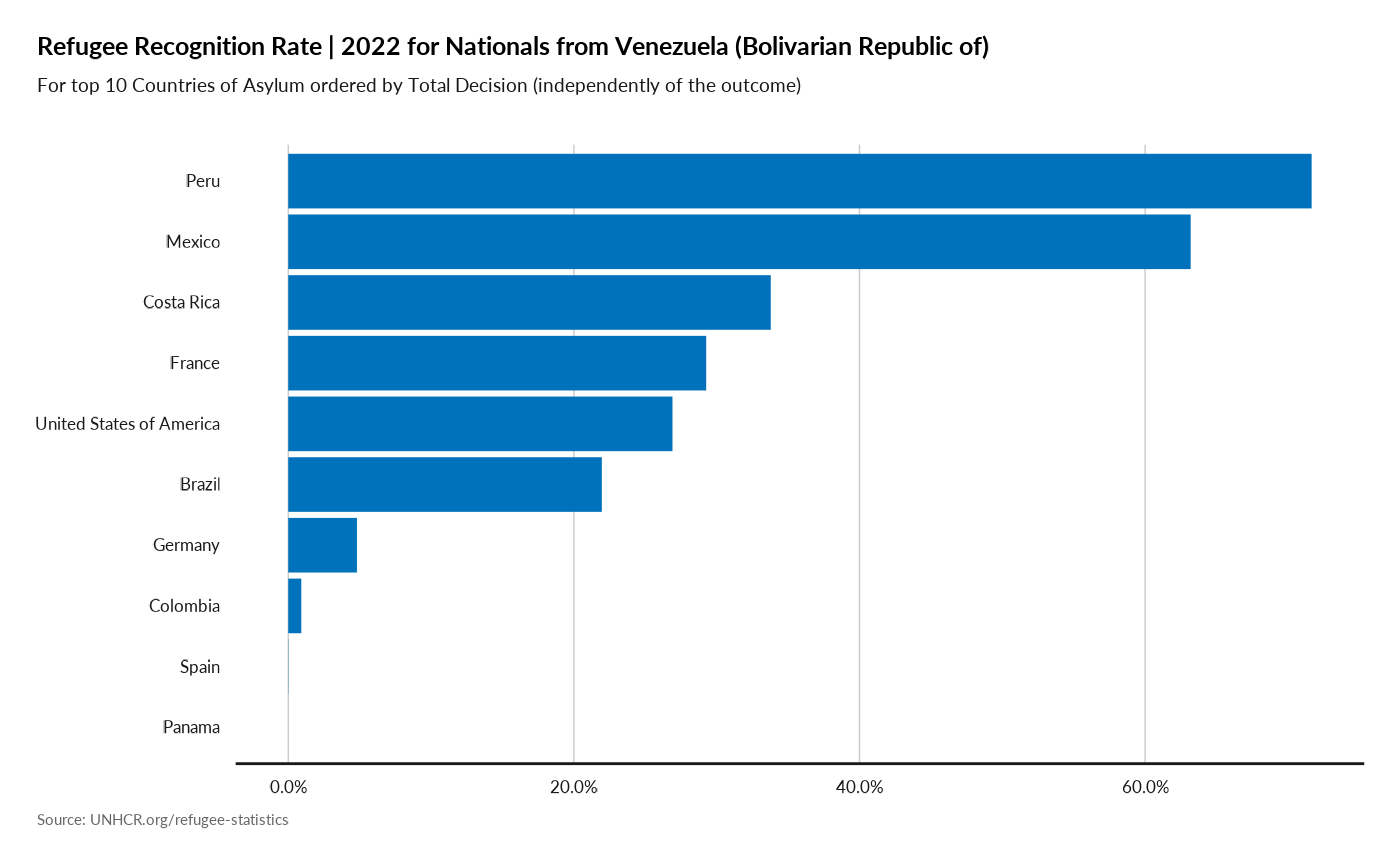
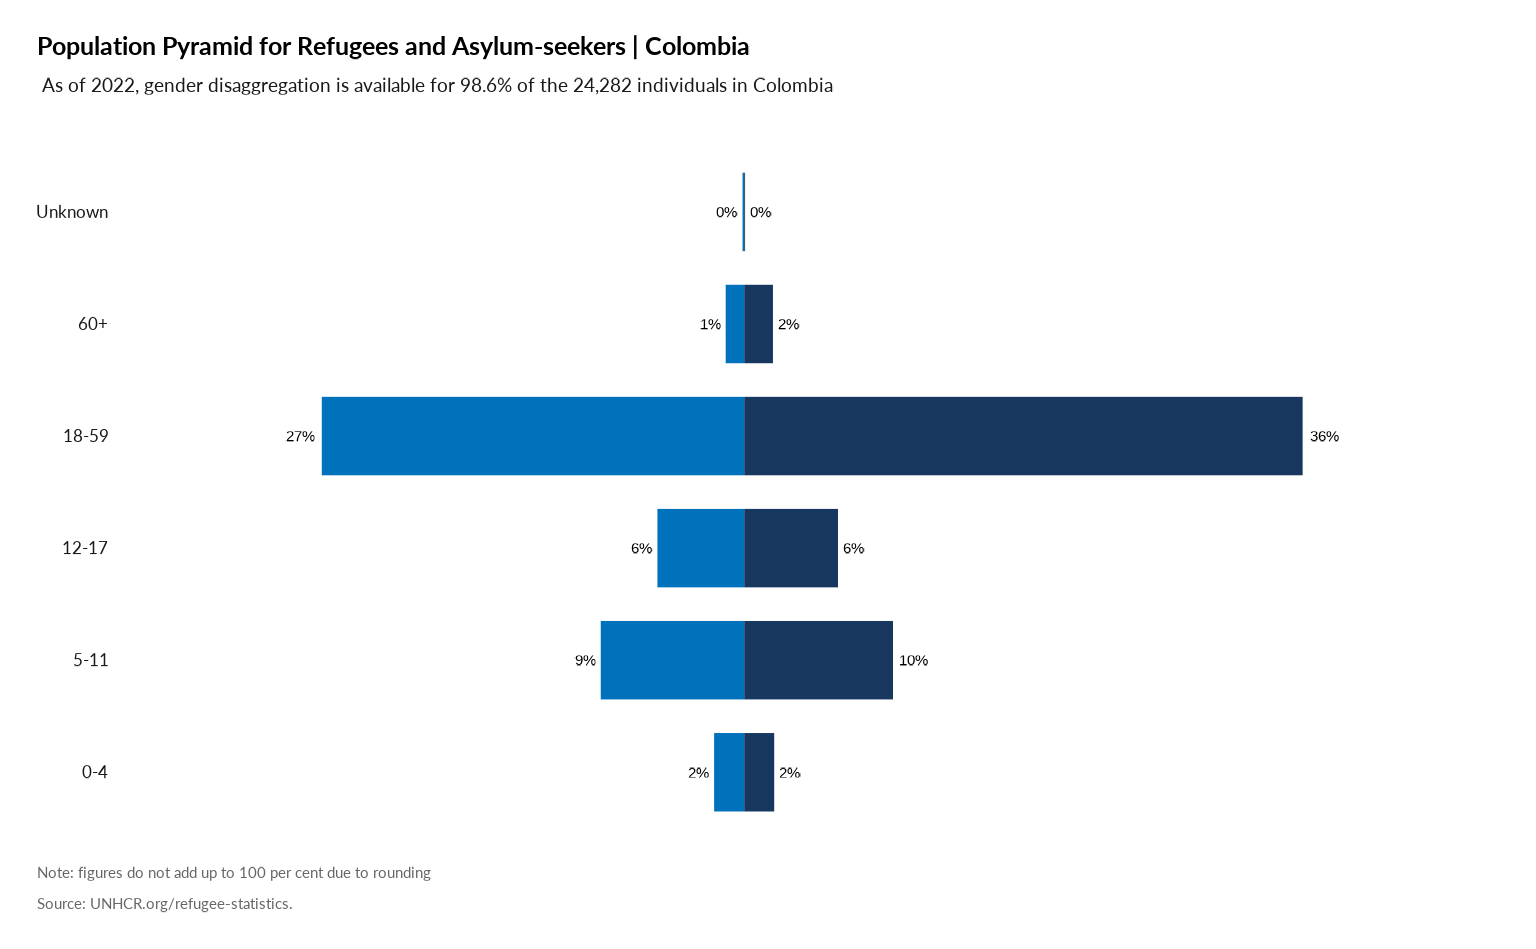
4. Profile
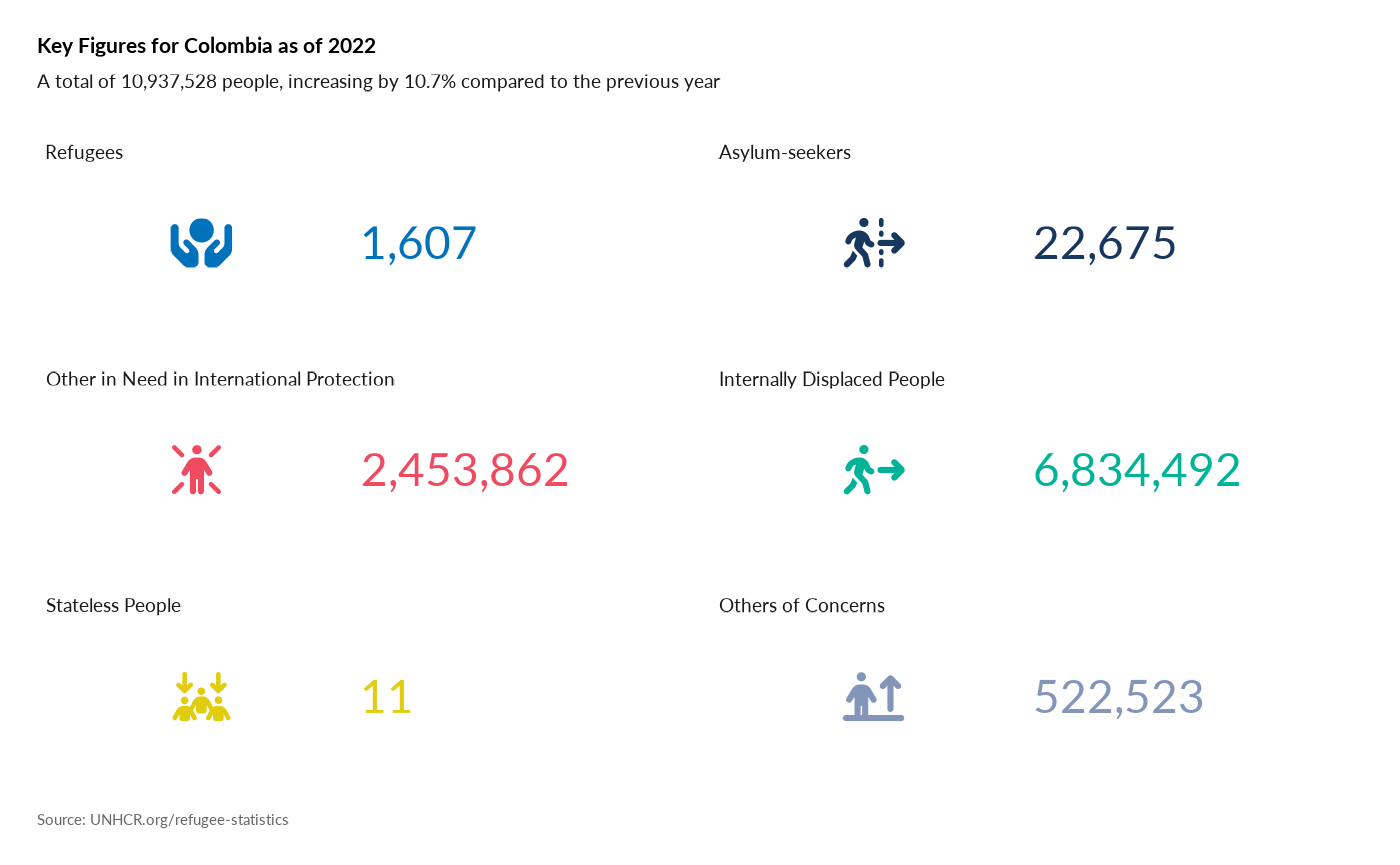
Plot Age Pyramid
#
plot_ctr_pyramid(year = 2022,
                 country_asylum_iso3c = "COL",
                 pop_type = c("ASY", "REF")
                 )
Plot locations within countries
# plot_ctr_location(year = 2022,
#                  country_asylum_iso3c = "COL",
#                  pop_type = c("ASY", "REF", "OIP"))
#
# plot_ctr_location(year = 2021,
#                  country_asylum_iso3c = "COL",
#                  pop_type = c("IDP"))
#
# plot_ctr_location(year = 2022,
#                  country_asylum_iso3c = "CAN",
#                  pop_type = c("ASY", "REF", "OIP"))
#
# plot_ctr_location(year = 2021,
#                  country_asylum_iso3c = "MEX",
#                  pop_type = c("ASY", "REF", "OIP"))
5. Processing
Plot Refugee Recognition rate in Country
plot_ctr_recognition(year = 2022,
                     country_asylum_iso3c = "USA",
                     top_n_countries = 10,
                     measure = "RefugeeRecognitionRate",
                     order_by = "TotalDecided" )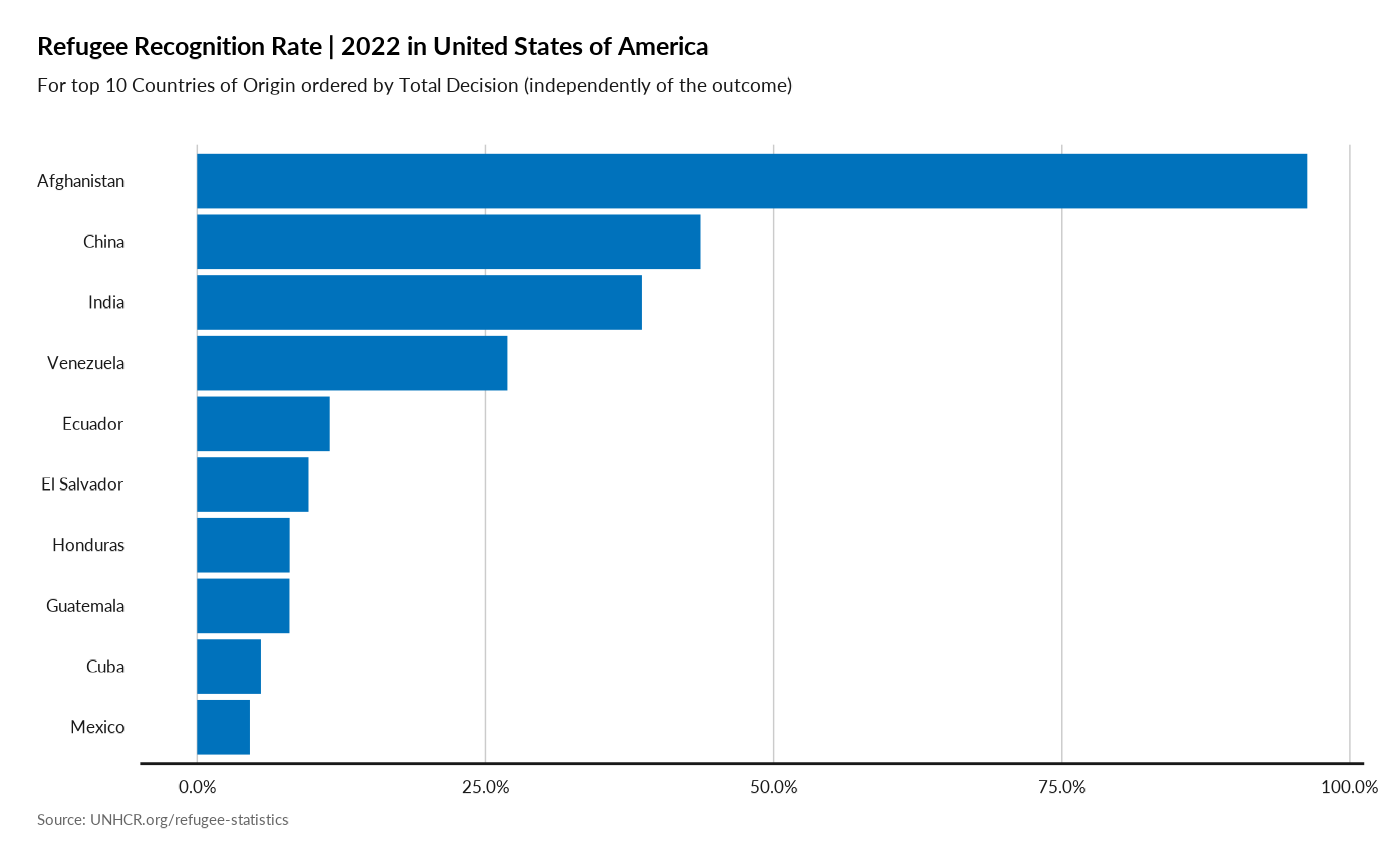
Asylum Applications & Decision over time
plot_ctr_asylum(year = 2022,
                country_asylum_iso3c = "ECU",
                            lag = 10)
#> Joining with `by = join_by(Year, CountryAsylumCode)`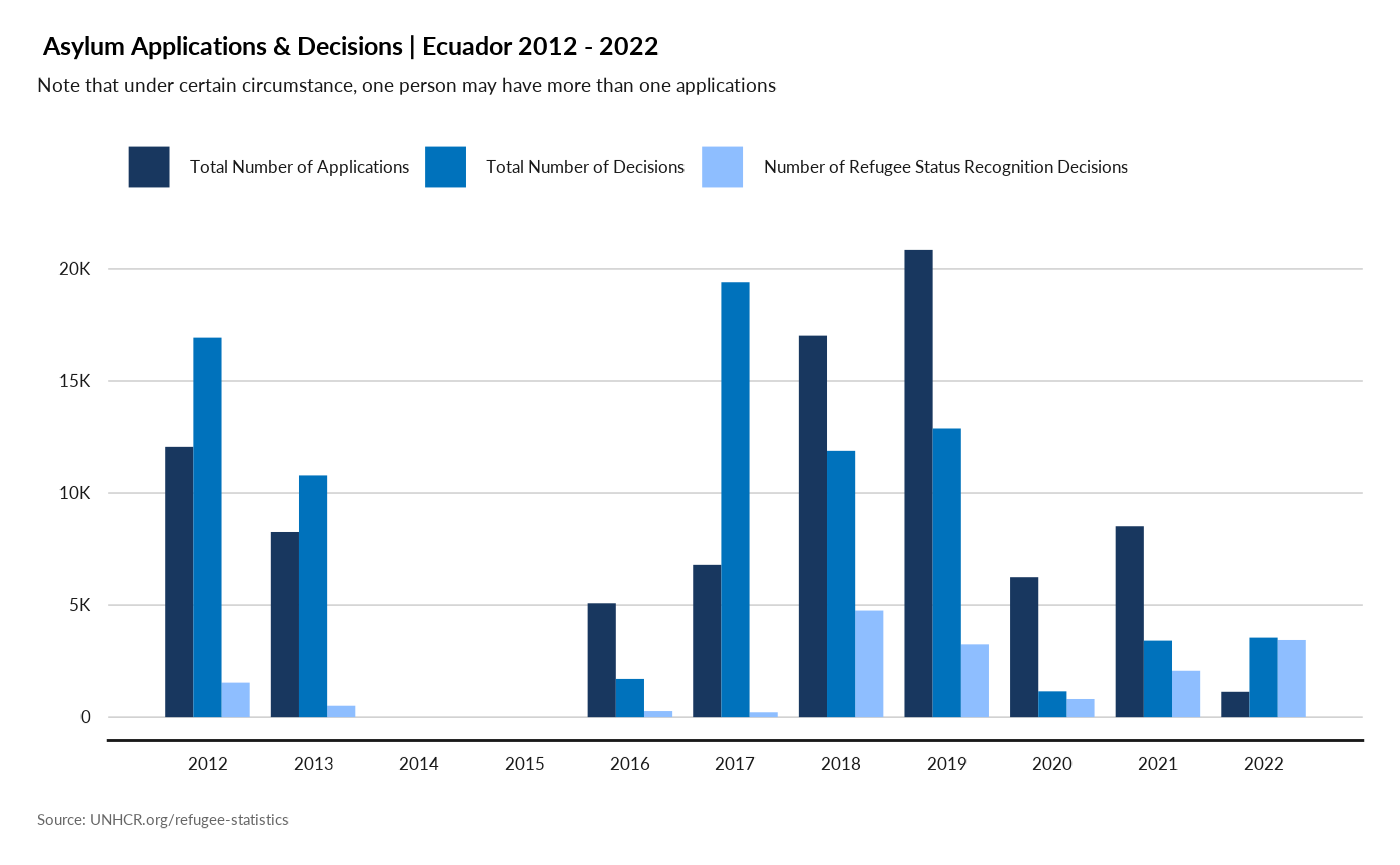
Asylum Processing
plot_ctr_process(year = 2022, country_asylum_iso3c = "BOL")
plot_ctr_process(year = 2022, country_asylum_iso3c = "CHL")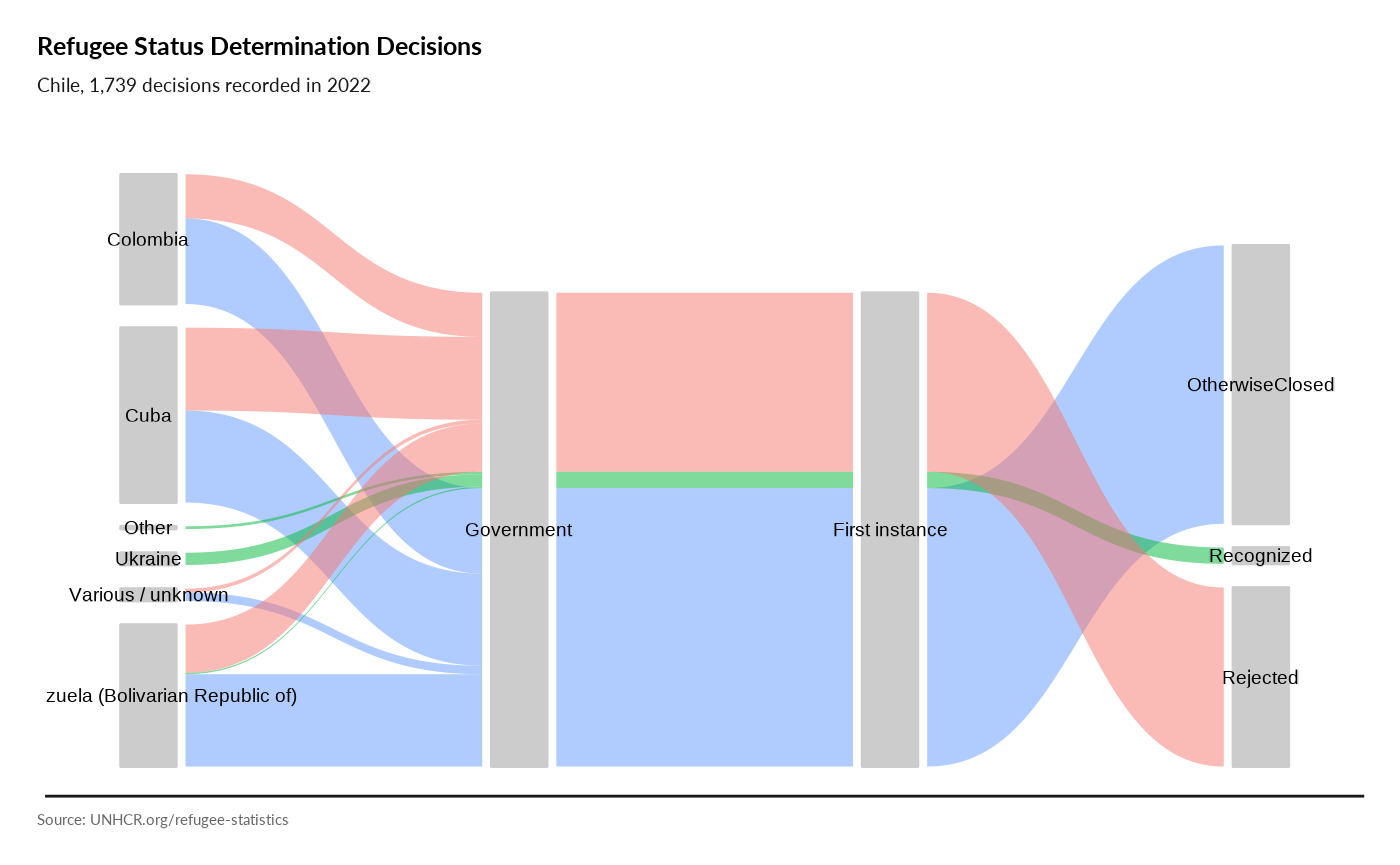
plot_ctr_process(year = 2022,   country_asylum_iso3c = "USA",
                              otherprop = .02)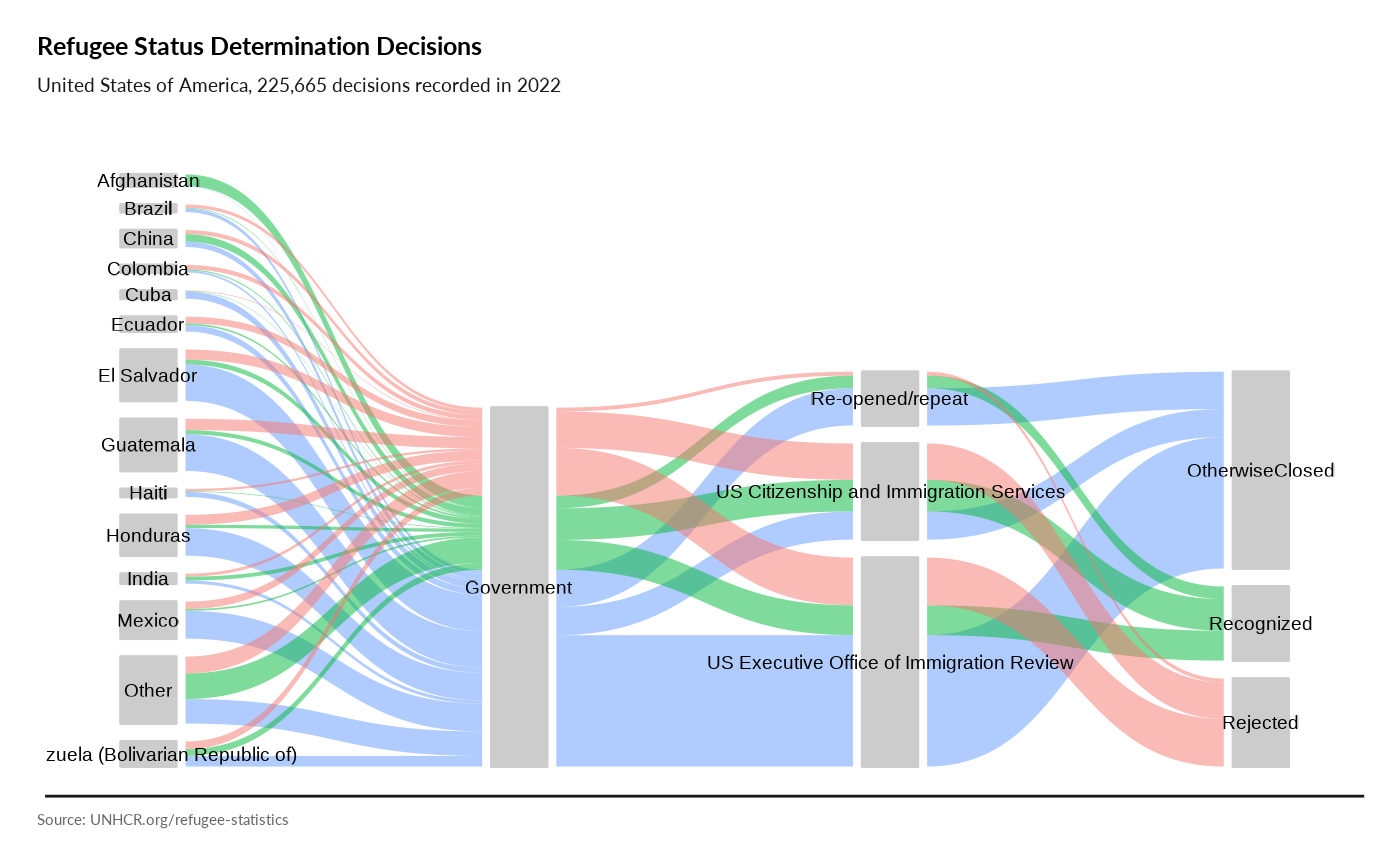
plot_ctr_process(year = 2022,   country_asylum_iso3c = "USA",
                              otherprop = .04)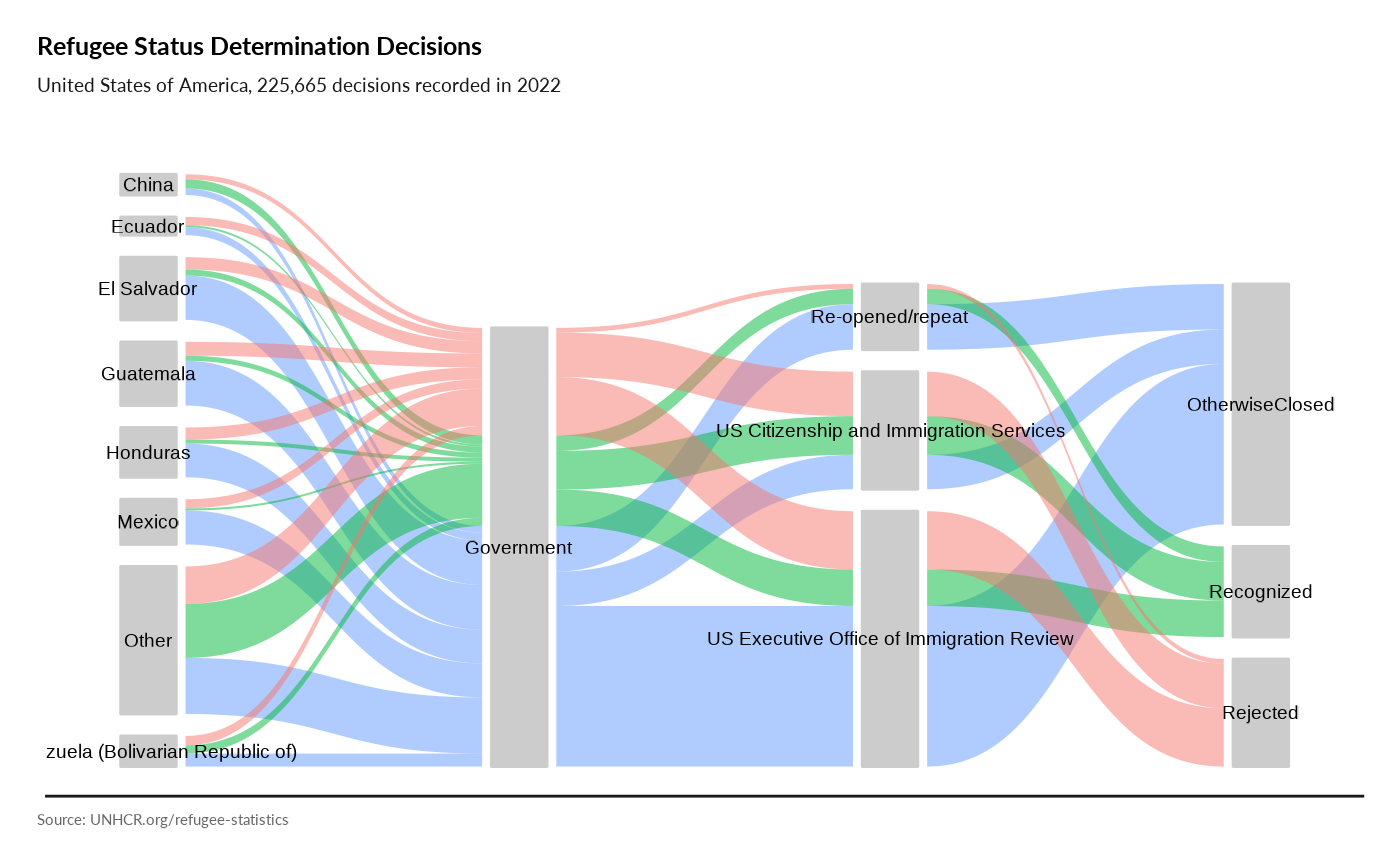
Average Asylum Processing Time
plot_ctr_processing_time(year = 2022,
                         country_asylum_iso3c = "ARG")
#> Joining with `by = join_by(Year, CountryAsylumCode)`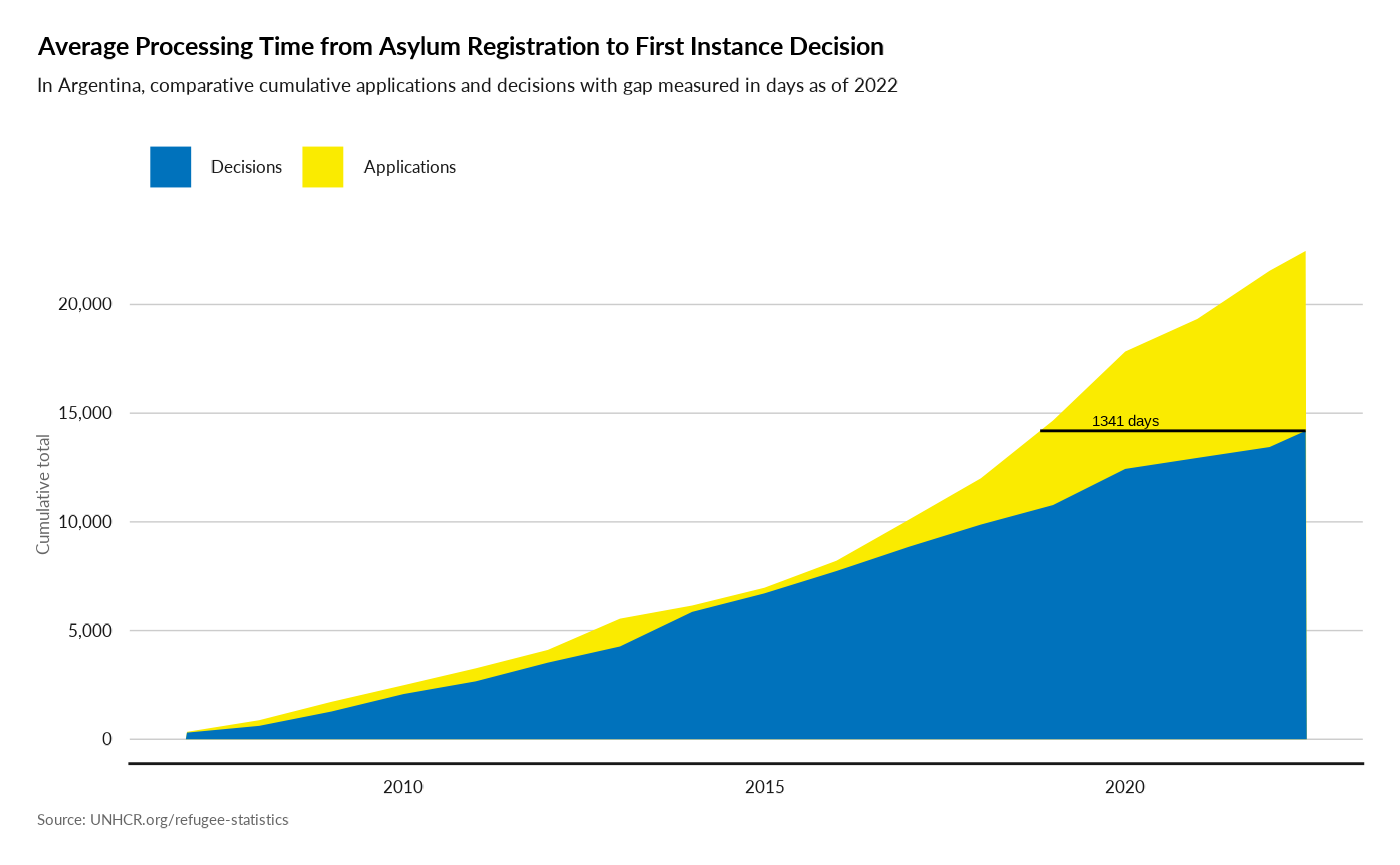
plot_ctr_processing_time(year = 2022,
                         country_asylum_iso3c = "USA")
#> Joining with `by = join_by(Year, CountryAsylumCode)`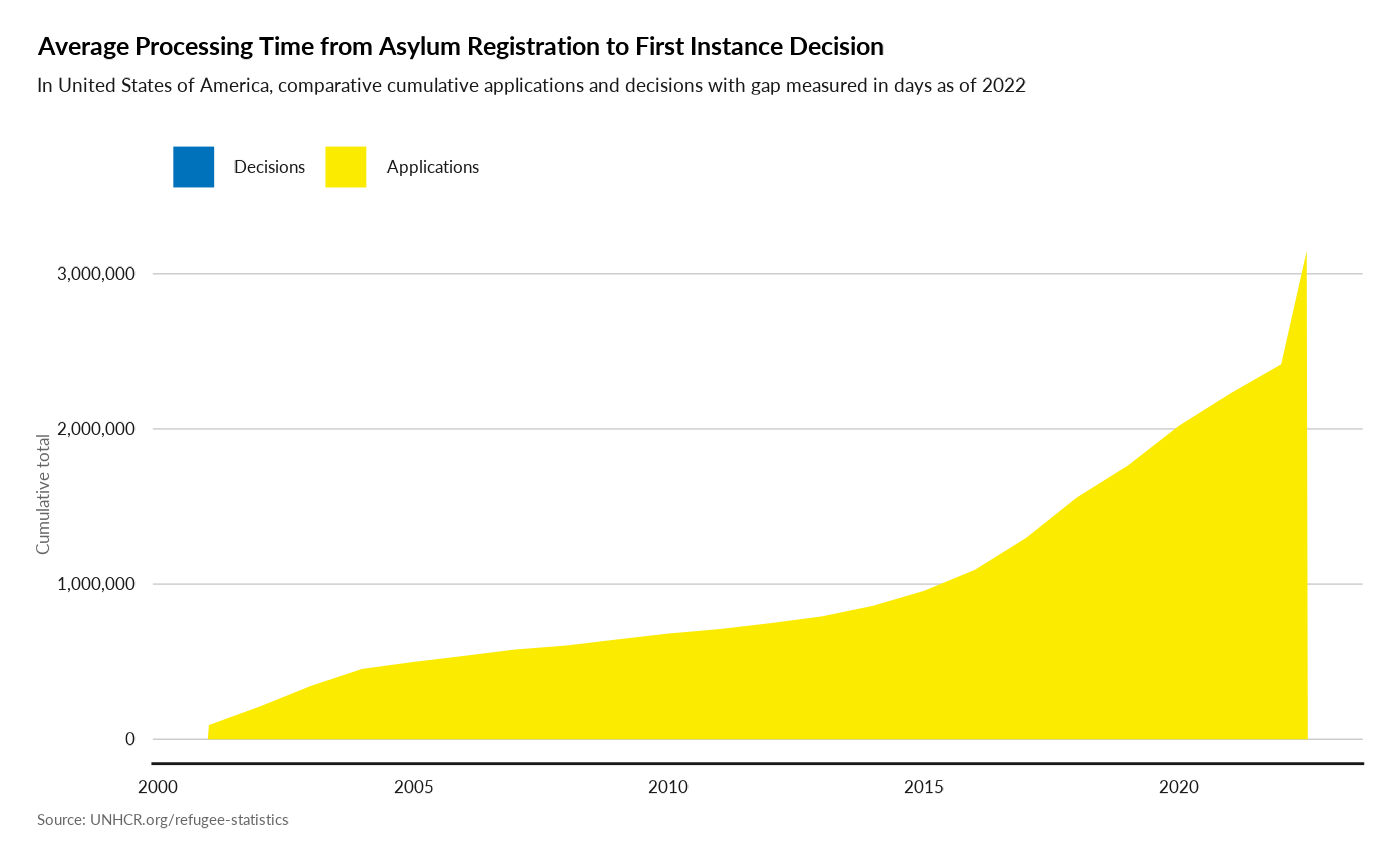
## Display a filtered version of the chart for a specific country and procedure
plot_ctr_processing_time(year = 2022,
                         country_asylum_iso3c = "EGY",
                         country_origin_iso3c = "ERI",
                         procedureType = "U")
#> Joining with `by = join_by(Year, CountryAsylumCode)`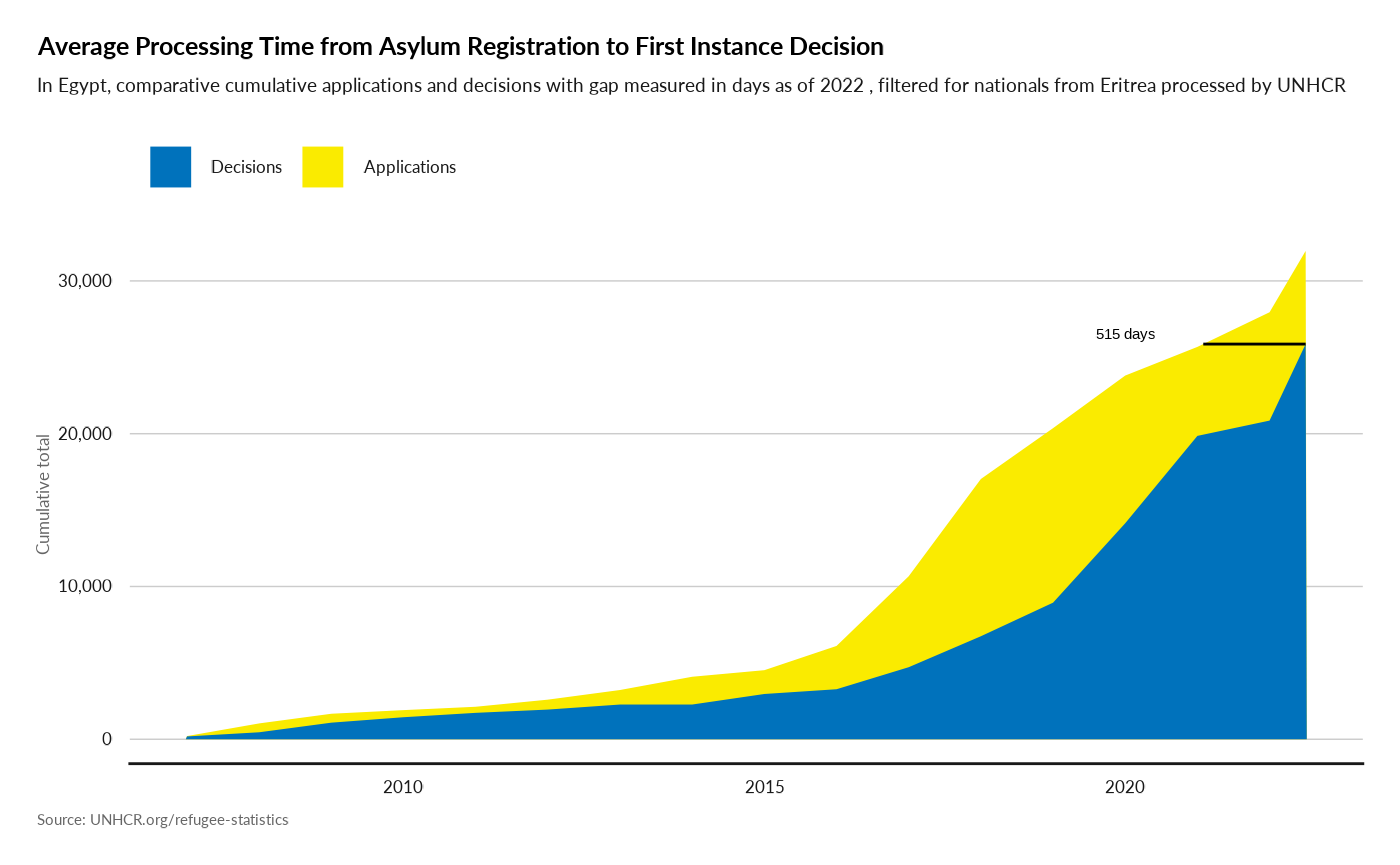
6. Solutions
Plot Solution Over time
plot_ctr_solution(year = 2021,
                  country_asylum_iso3c= "UGA",
                  lag = 10,
                  sol_type = c("NAT", "RST", "RET", "RDP"))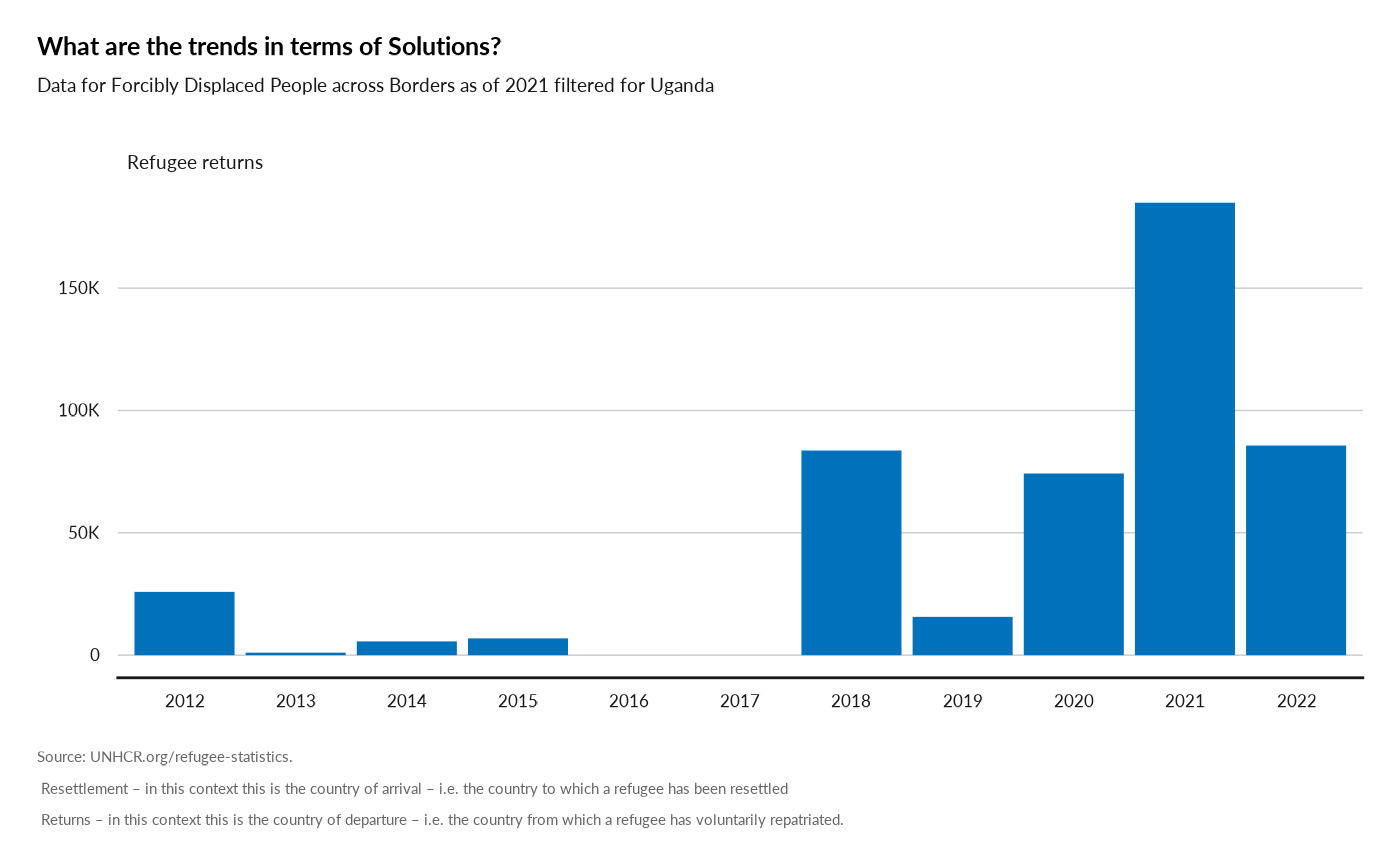
Plot Solution Over Recognition
plot_ctr_solution_recognition(year = 2022,
                  country_asylum_iso3c= "UGA",
                  lag = 10)
#> `geom_braid()` using method = 'line'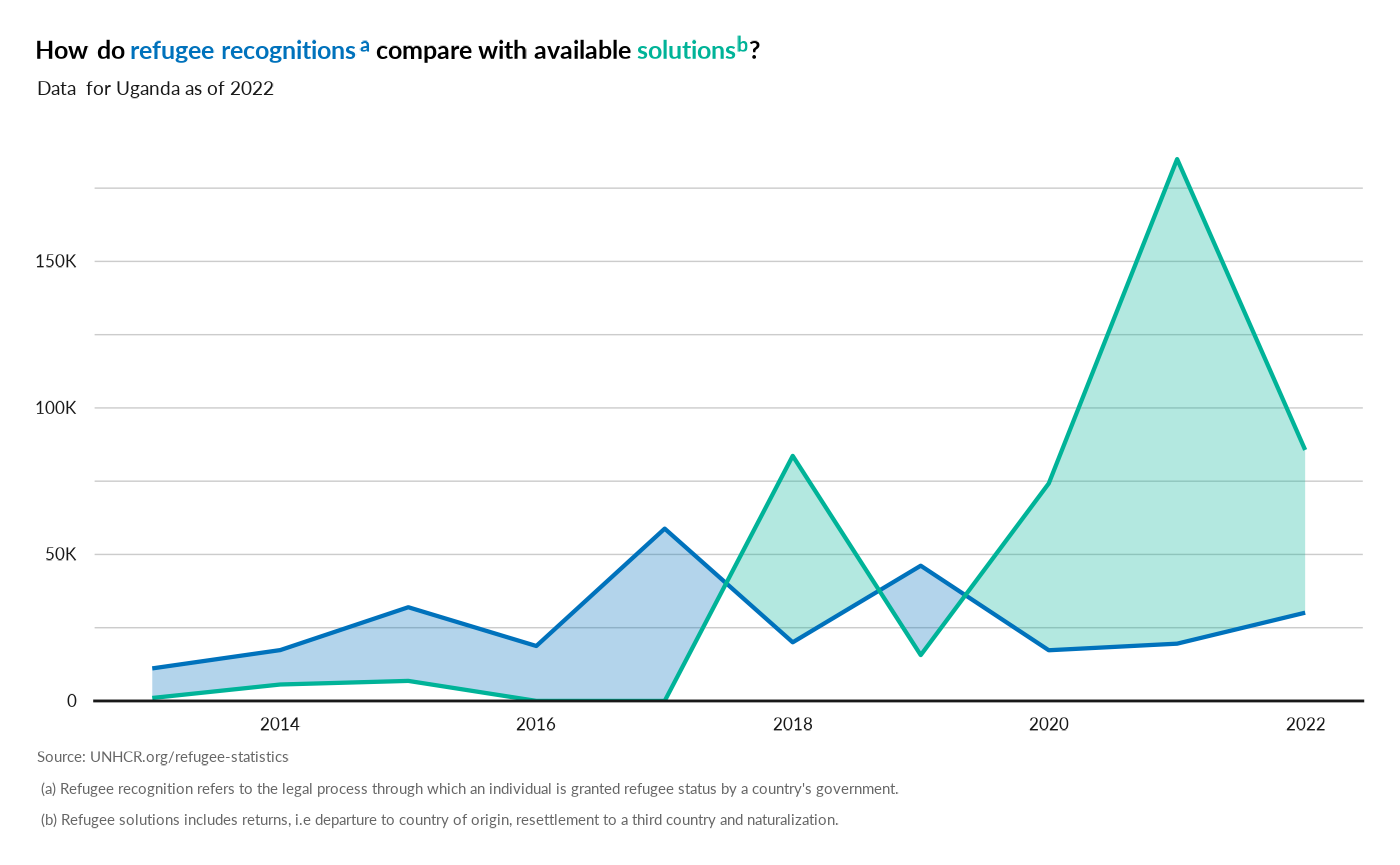
7.Migrant
Plot Ratio Refugee Migrant
plot_ctr_disp_migrant(year = 2022,
                    country_asylum_iso3c = "MEX" ,
                    top_n_countries = 10)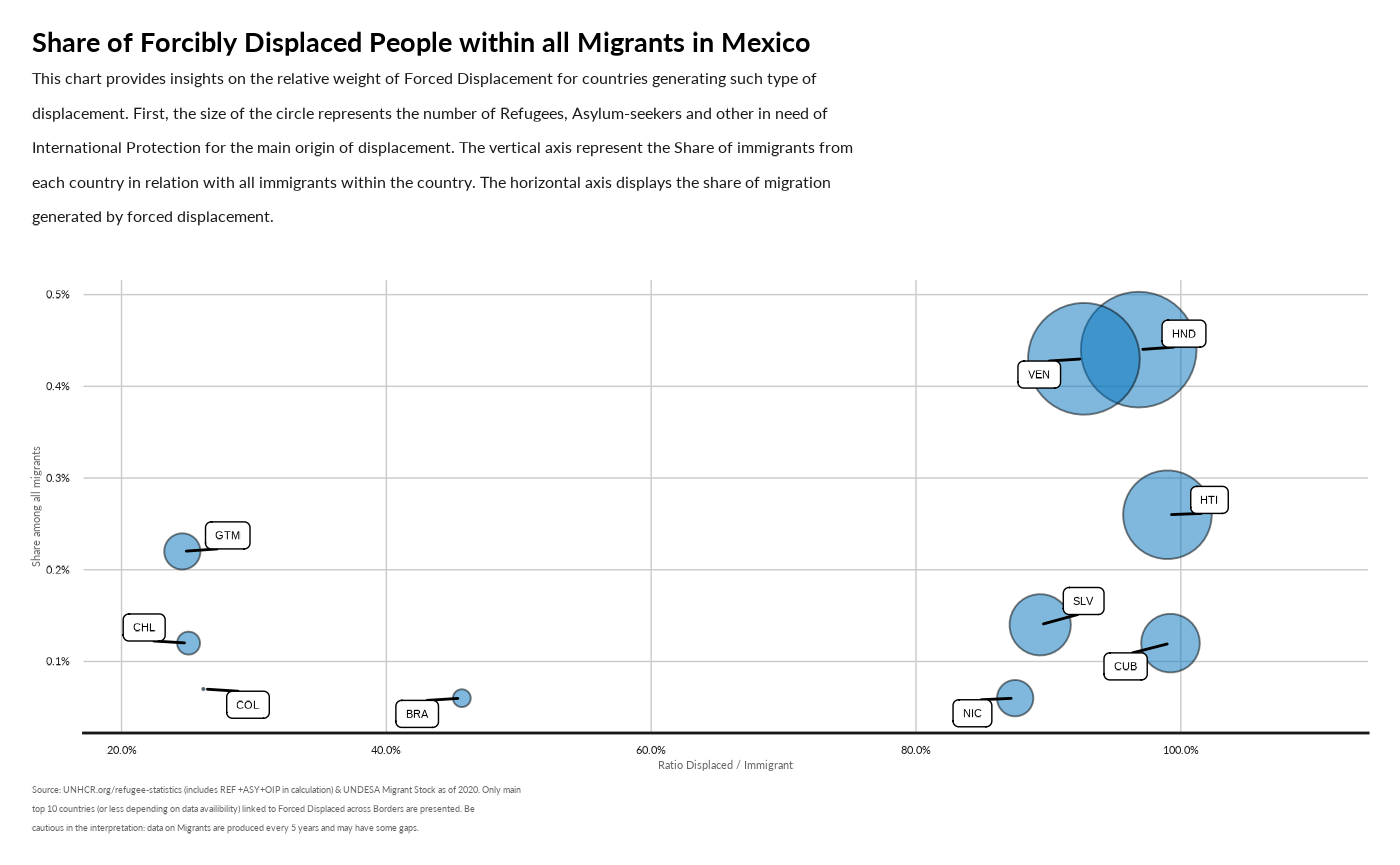
# plot_ctr_disp_migrant(year = 2022,
#                     country_asylum_iso3c = "FRA" )