library(ftsAnalysis)
#> Registered S3 method overwritten by 'quantmod':
#>   method            from
#>   as.zoo.data.frame zoo
Using Language Models to build data stories
clean_llm_response
response <- "<think>
First, I'm a humanitarian data visualization expert. My role includes extracting insights
from visualizations, creating accessible narratives, highlighting patterns relevant to aid
efforts, using clear language with emotional resonance.
Aligning with constraints: Use plain language, be concise and impactful. Don't rehash
every detail; build narrative depth around 2 key insights maximum in under 30 tokens.
</think>
This visualization tracks a relationship potentially critical for humanitarian logistics:
higher fuel consumption versus increased weight. 车辆设计"
clean_llm_response(response)
#> [1] "This visualization tracks a relationship potentially critical for humanitarian logistics: higher fuel consumption versus increased weight."
generate_plot_story
library(ggplot2)
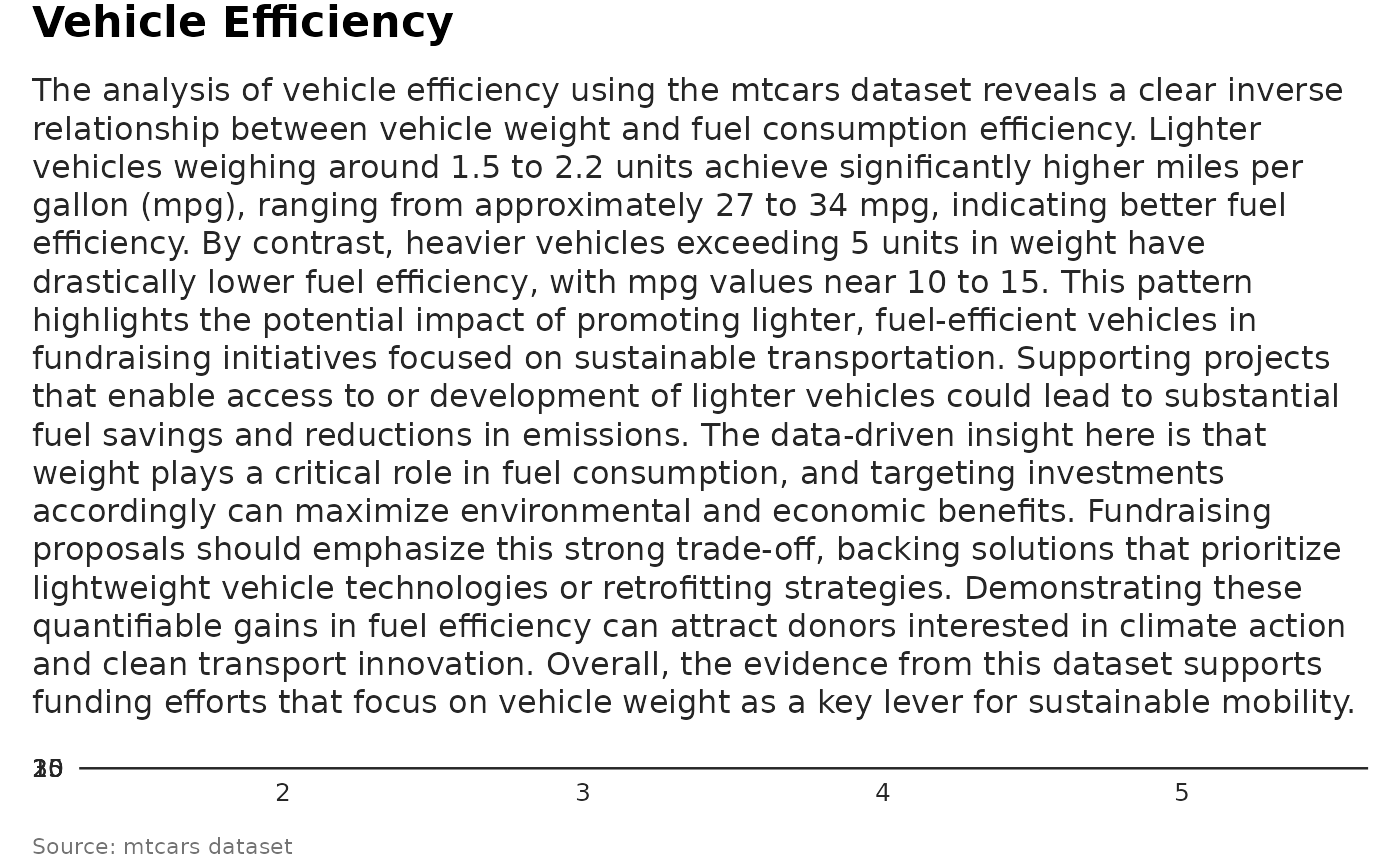
p <- ggplot(mtcars, aes(x = wt, y = mpg)) +
geom_point() +
unhcrthemes::theme_unhcr(grid = "Y", axis = "X", axis_title = FALSE) +
labs(title = "Vehicle Efficiency",
subtitle = "Fuel consumption vs weight",
caption = "Source: mtcars dataset")
generate_plot_story(p, provider = "ollama", model = "deepseek-r1")
#> [1] "This plot shows efficient fuel use with lighter vehicles."
story <- generate_plot_story(p, provider = "azure", model = "gpt-4.1-mini", max_tokens = 300)
# To use as subtitle:
p + ggplot2::labs(subtitle = story)
Donor Plots
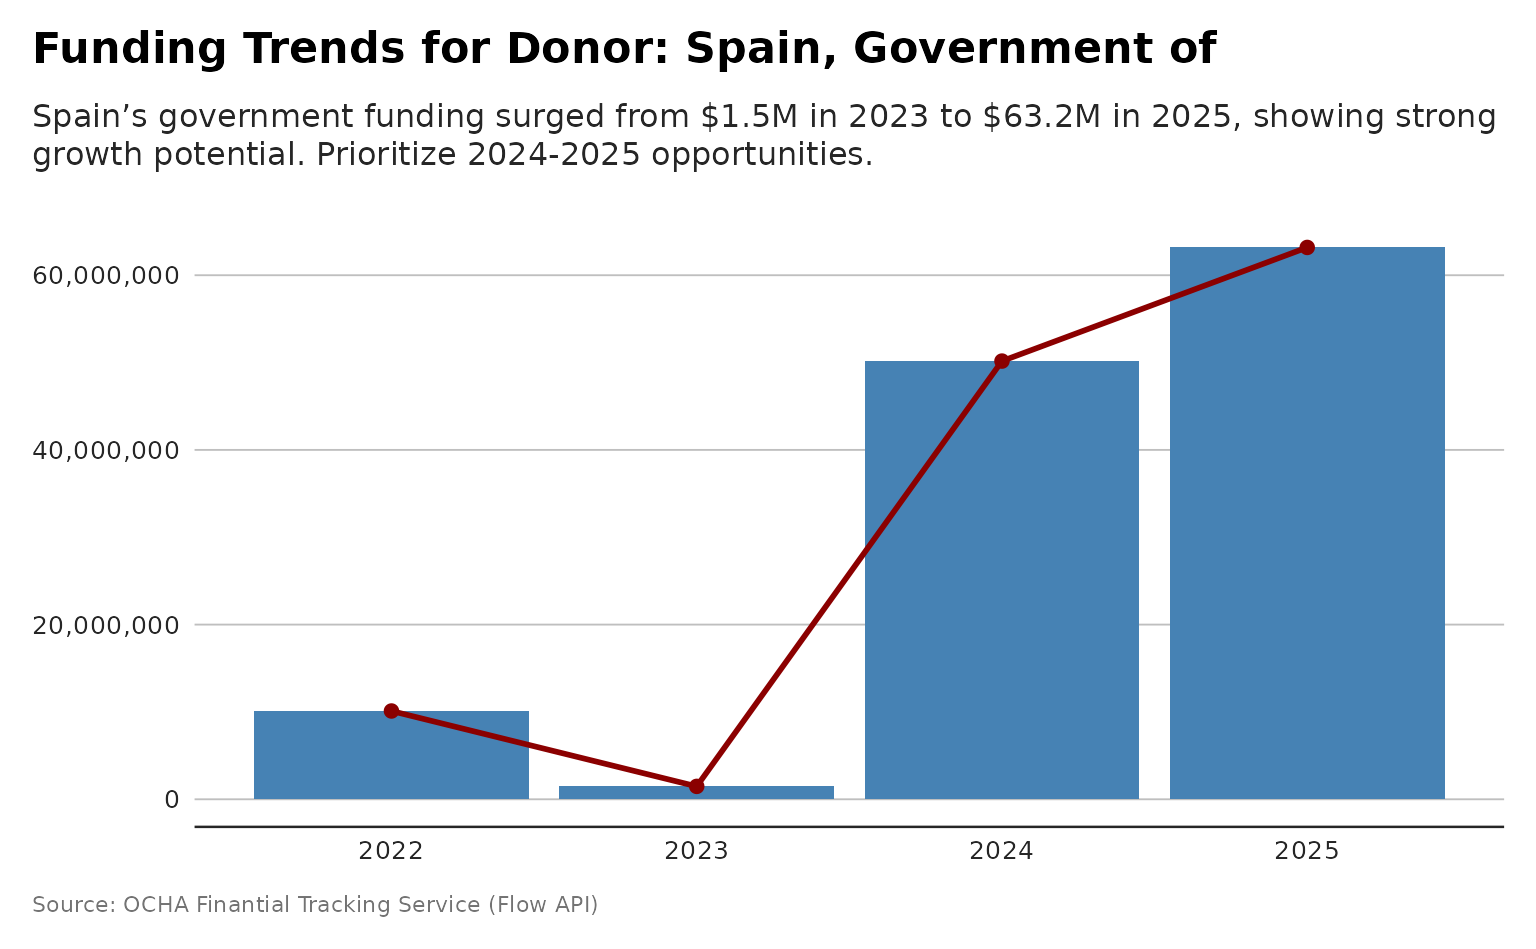
plot_donor_funding_over_time
p <- plot_donor_funding_over_time(flows, donor_name= "Spain, Government of")
#> Warning: Using `size` aesthetic for lines was deprecated in ggplot2 3.4.0.
#> ℹ Please use `linewidth` instead.
#> ℹ The deprecated feature was likely used in the ftsAnalysis package.
#>   Please report the issue at
#>   <https://github.com/edouard-legoupil/ftsAnalysis/issues>.
#> This warning is displayed once every 8 hours.
#> Call `lifecycle::last_lifecycle_warnings()` to see where this warning was
#> generated.
# and plot with more powerful subtitle
dubbed <- generate_plot_story(p, provider = "azure", model = "gpt-4.1-mini")
print(p + ggplot2::labs(subtitle = dubbed))
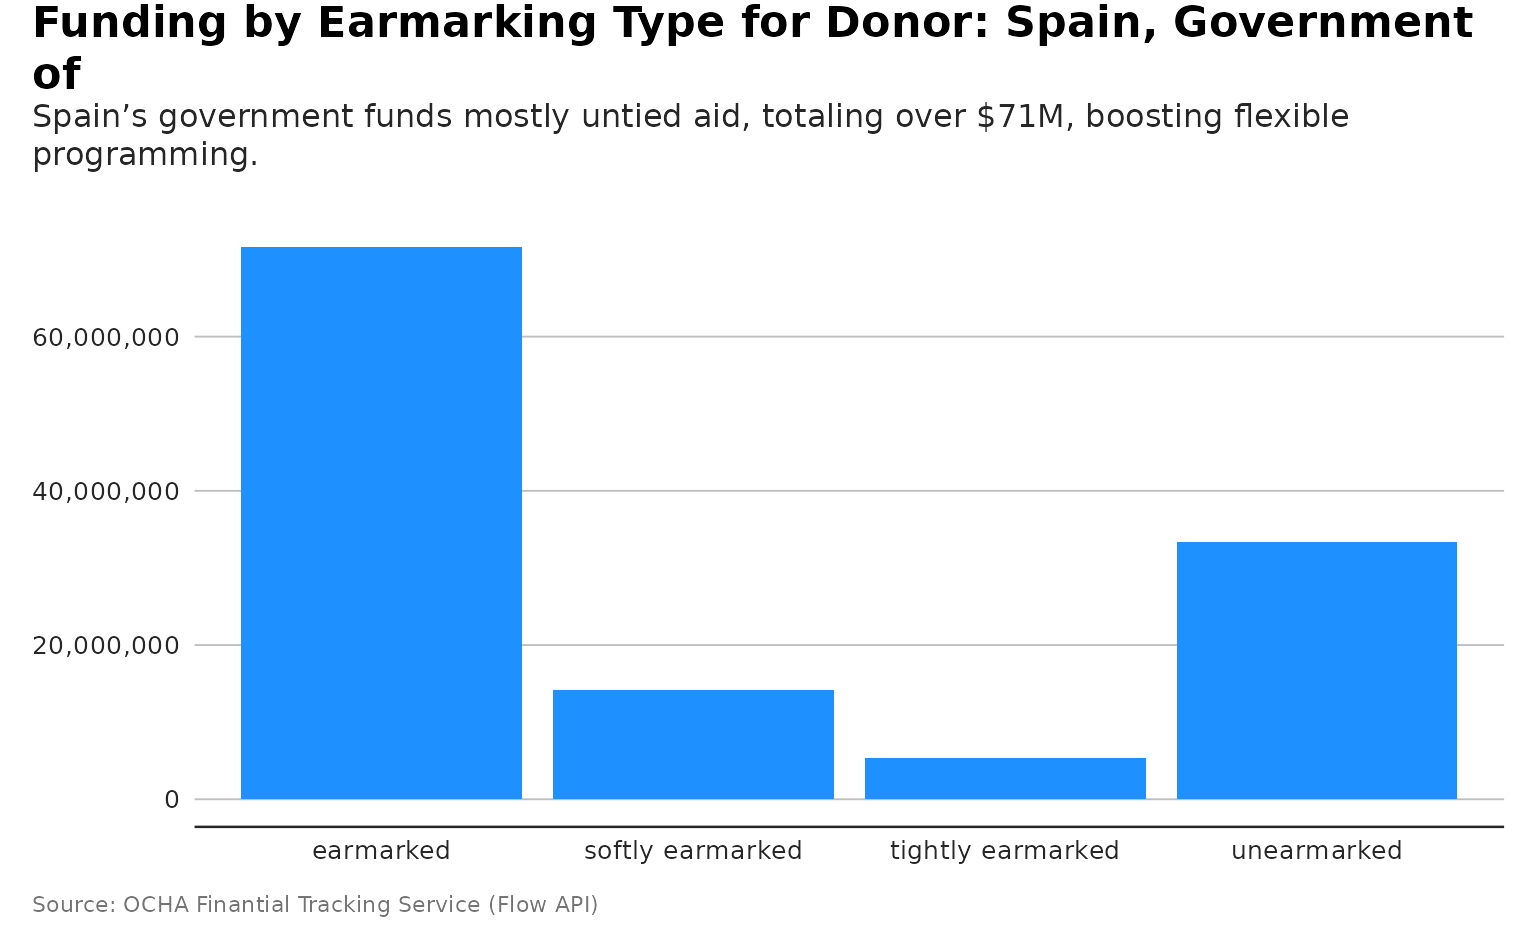
plot_donor_earmarking
p <- plot_donor_earmarking(flows, donor_name= "Spain, Government of")
# and plot with more powerful subtitle
dubbed <- generate_plot_story(p, provider = "azure", model = "gpt-4.1-mini")
p + ggplot2::labs(subtitle = dubbed)
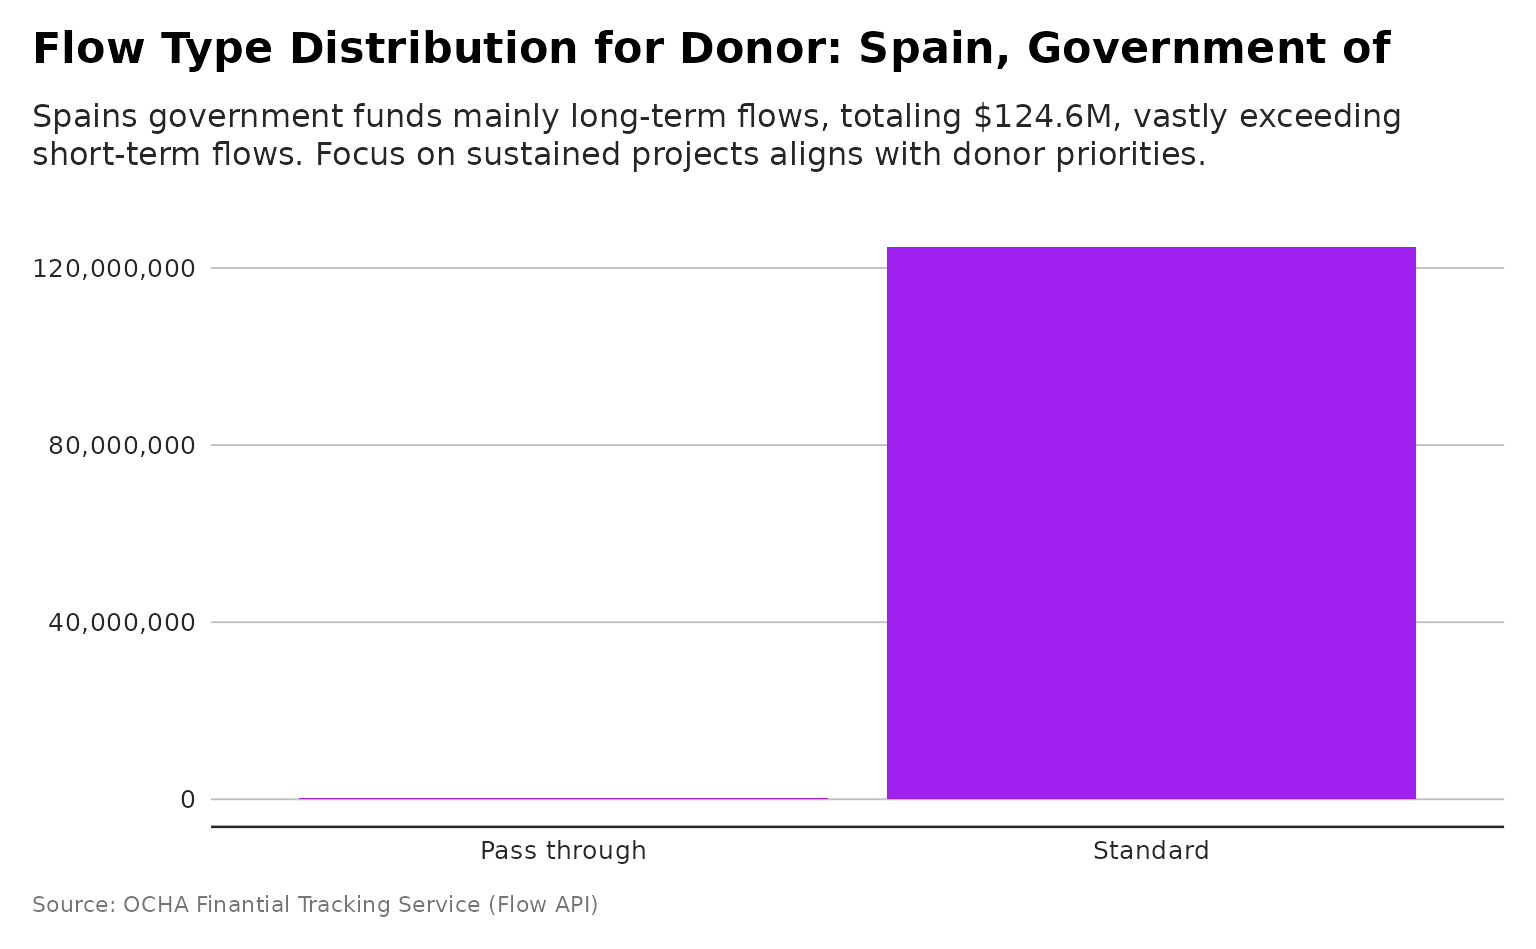
plot_donor_flowtype
p <- plot_donor_flowtype(flows, donor_name= "Spain, Government of")
# and plot with more powerful subtitle
dubbed <- generate_plot_story(p, provider = "azure", model = "gpt-4.1-mini")
p + ggplot2::labs(subtitle = dubbed)
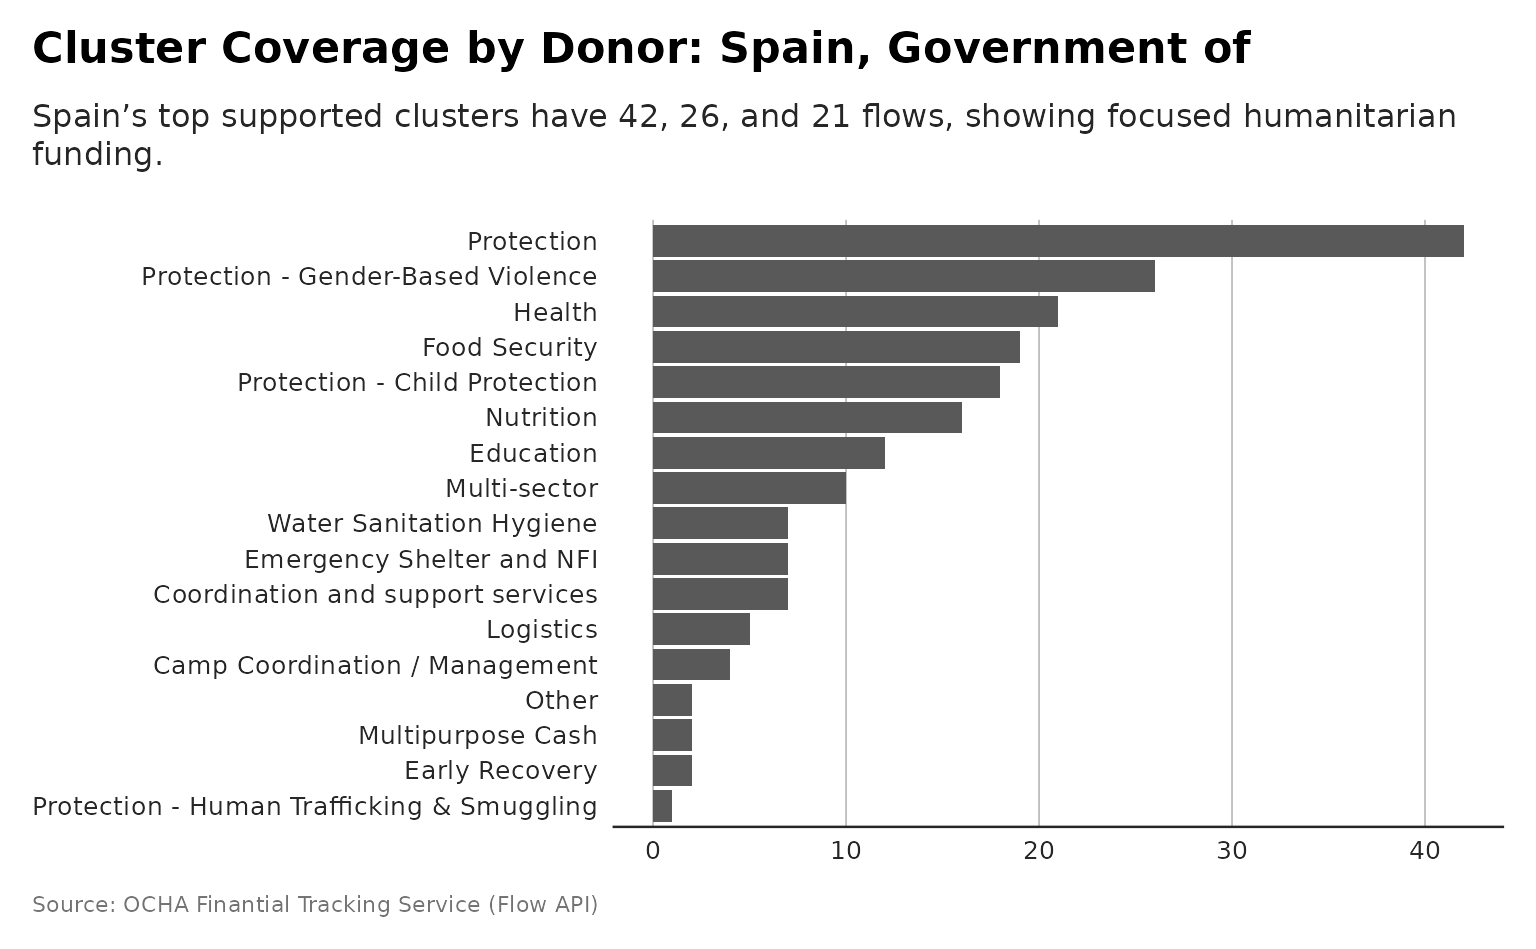
plot_donor_cluster_coverage
Recipient Plot
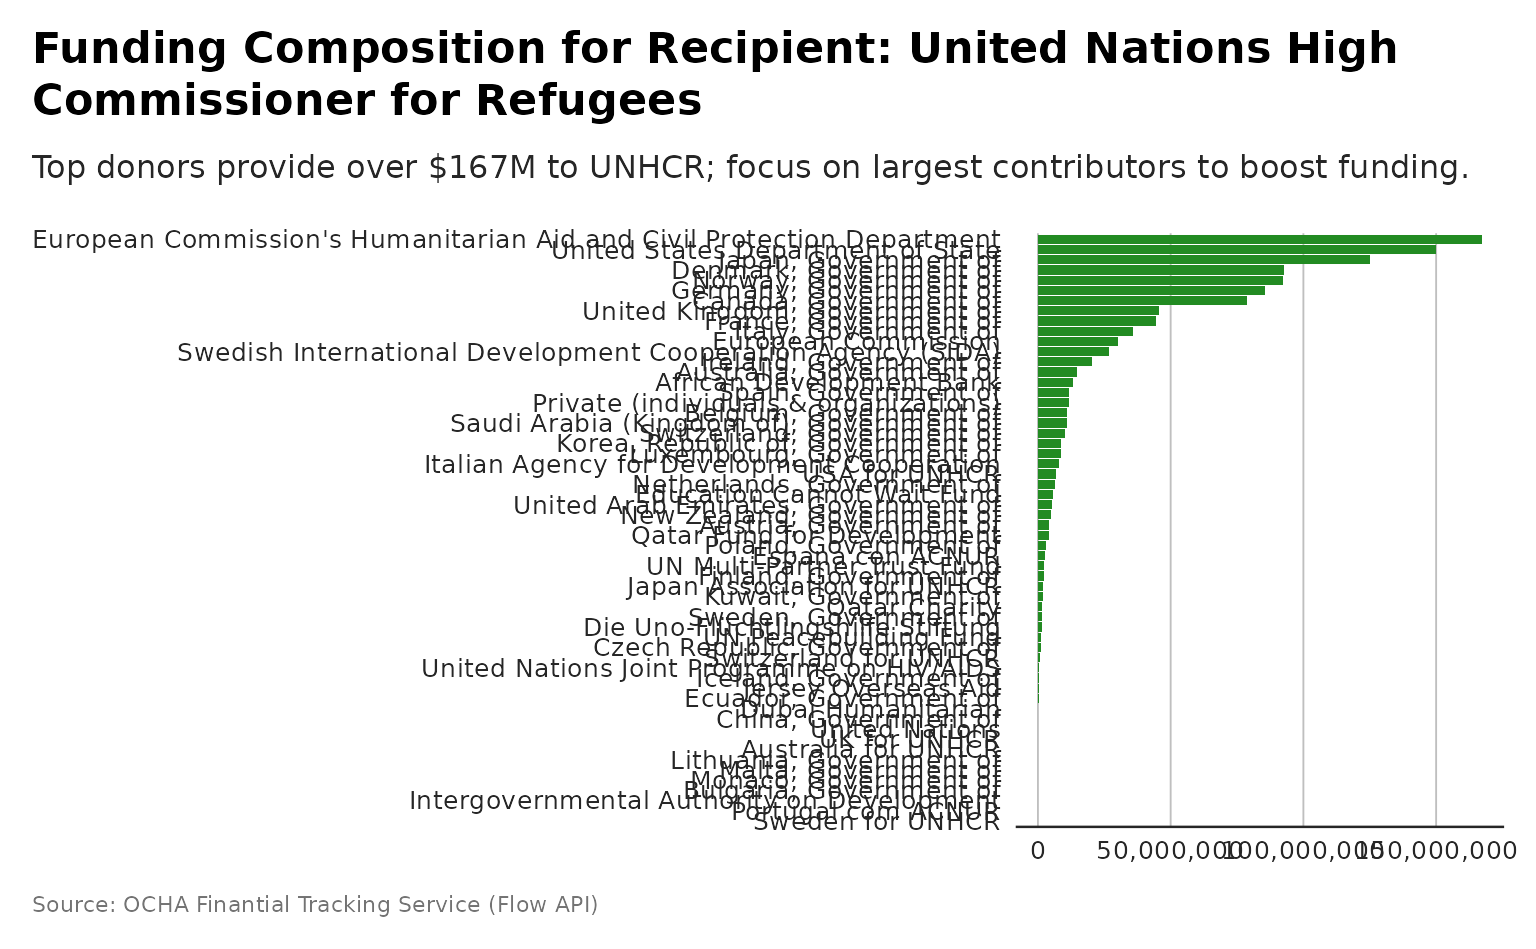
plot_recipient_funding_composition
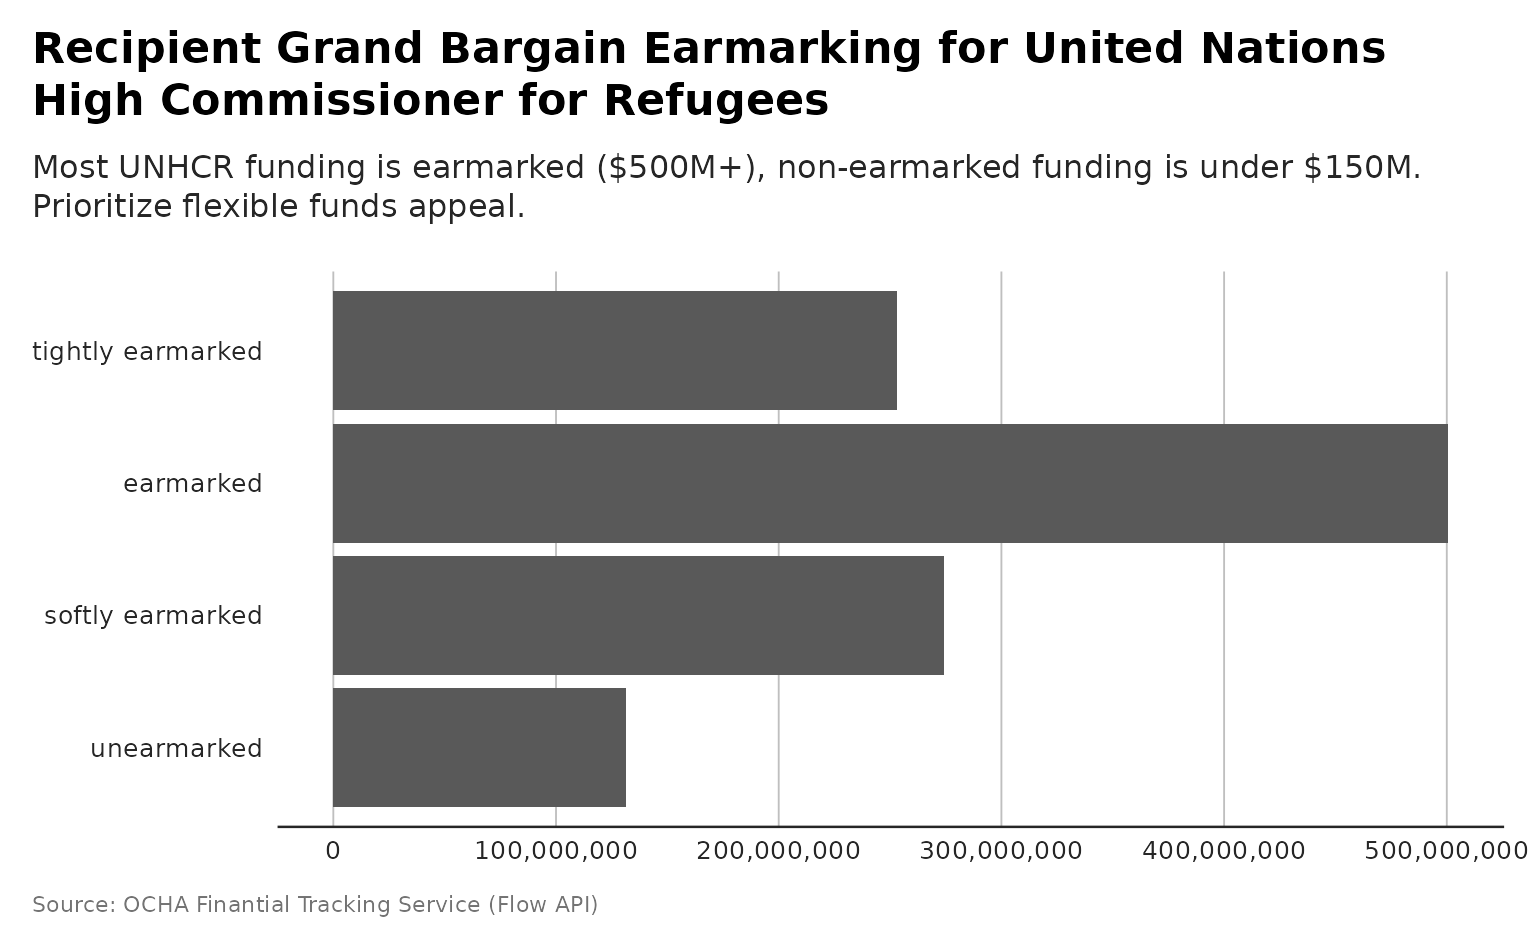
plot_recipient_grandbargain
p <- plot_recipient_grandbargain(flows,
          recipient_name = "United Nations High Commissioner for Refugees")
#> Scale for y is already present.
#> Adding another scale for y, which will replace the existing scale.
# and plot with more powerful subtitle
dubbed <- generate_plot_story(p, provider = "azure", model = "gpt-4.1-mini")
p + ggplot2::labs(subtitle = dubbed)
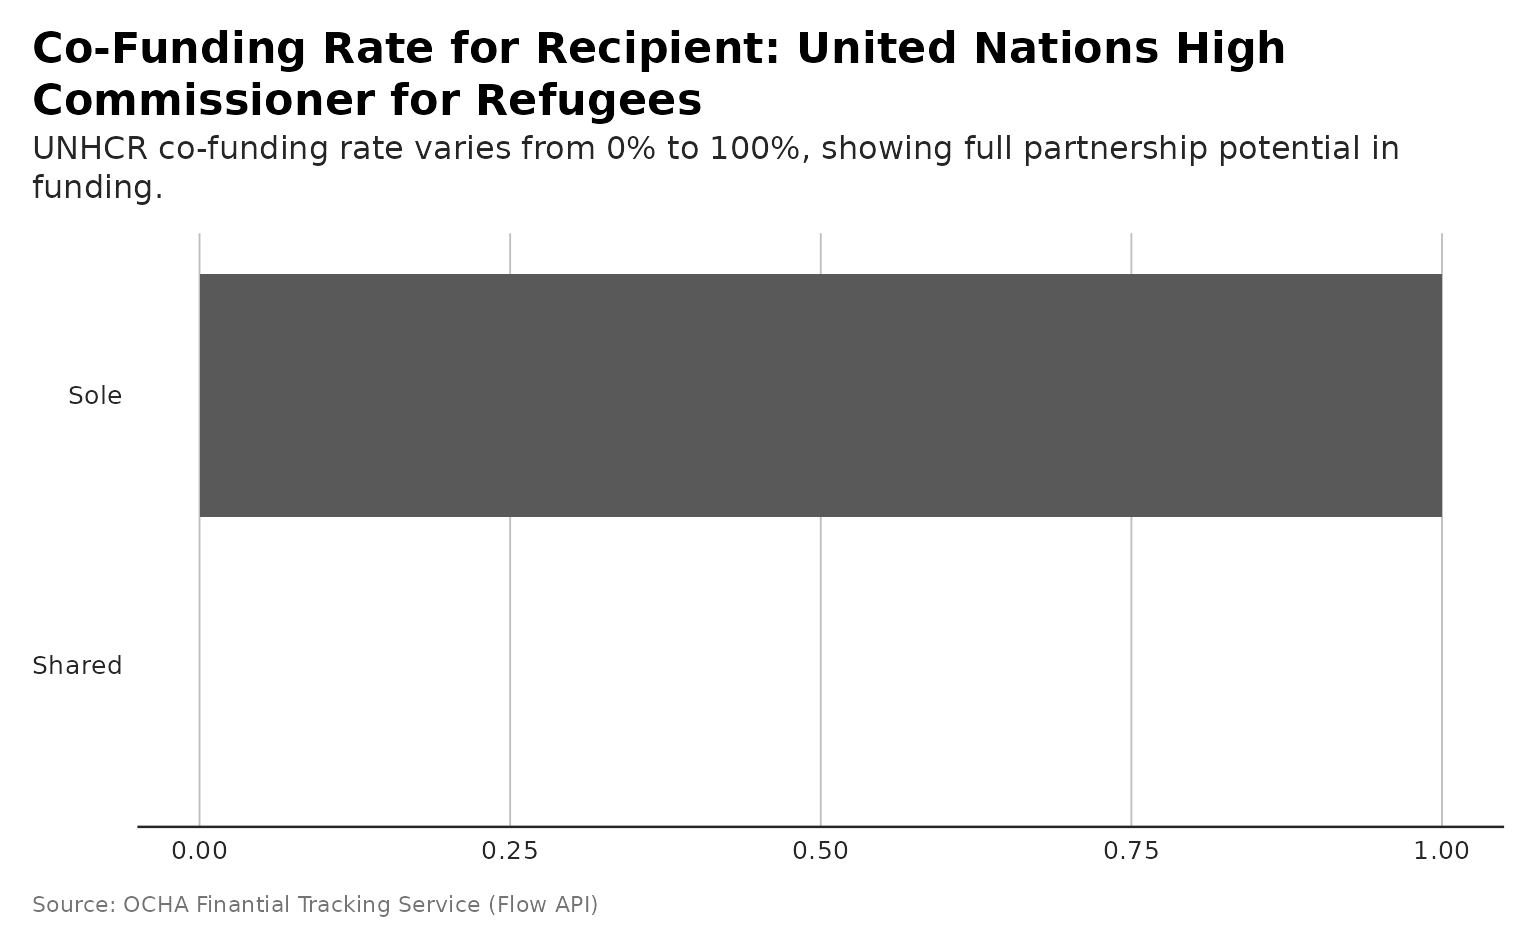
plot_recipient_cofunding
p <- plot_recipient_cofunding(flows,
              recipient_name = "United Nations High Commissioner for Refugees")
# and plot with more powerful subtitle
dubbed <- generate_plot_story(p, provider = "azure", model = "gpt-4.1-mini")
p + ggplot2::labs(subtitle = dubbed)
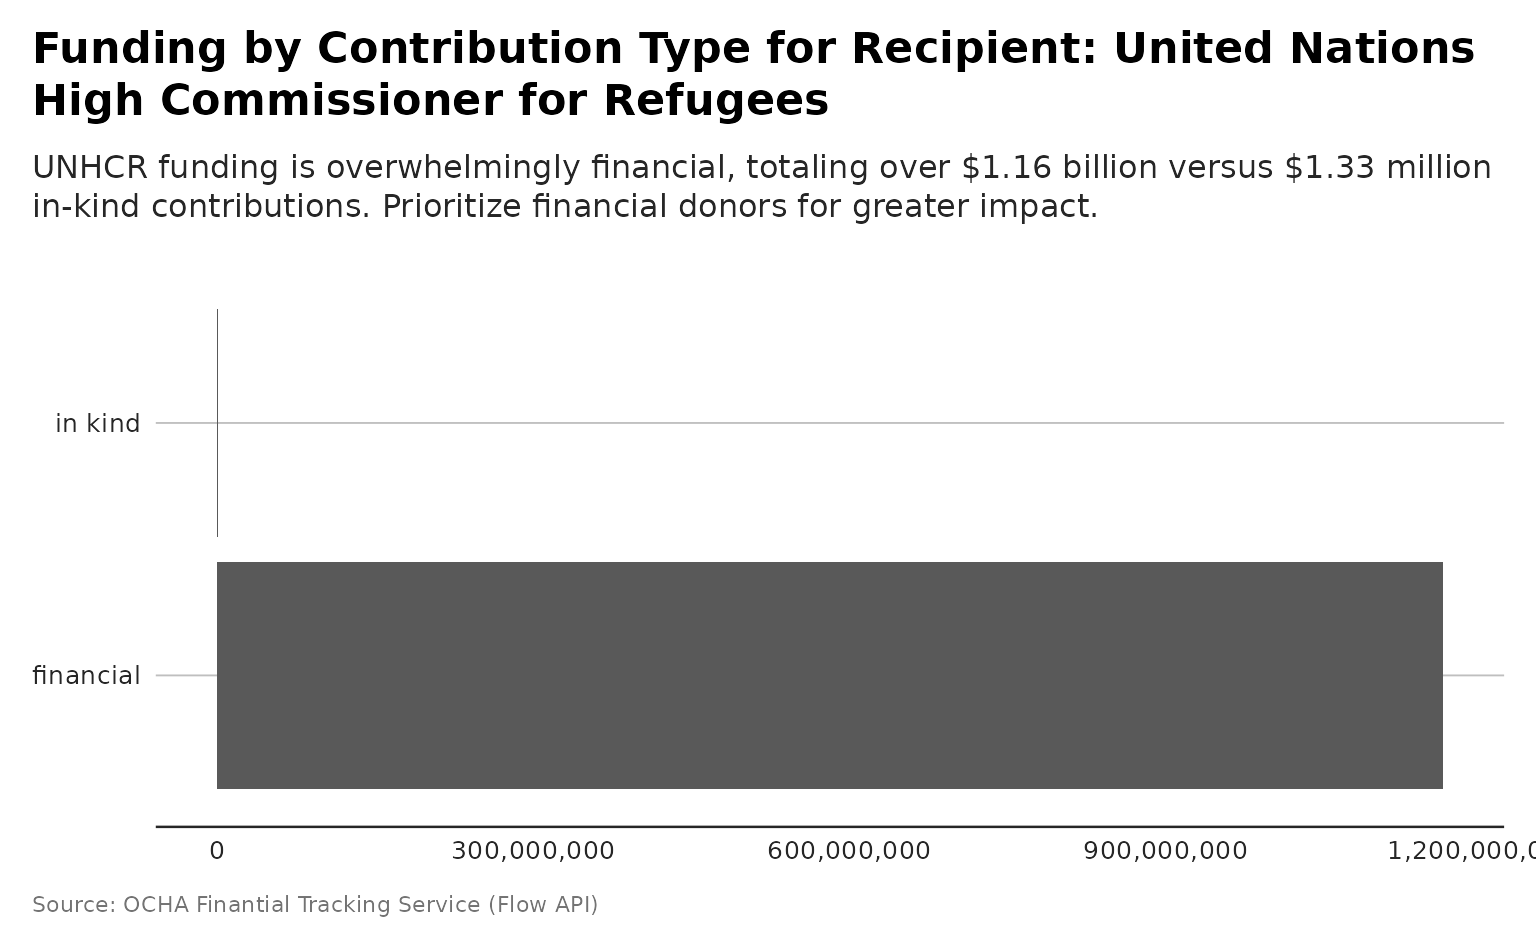
plot_recipient_contribution_type
Destination Plot
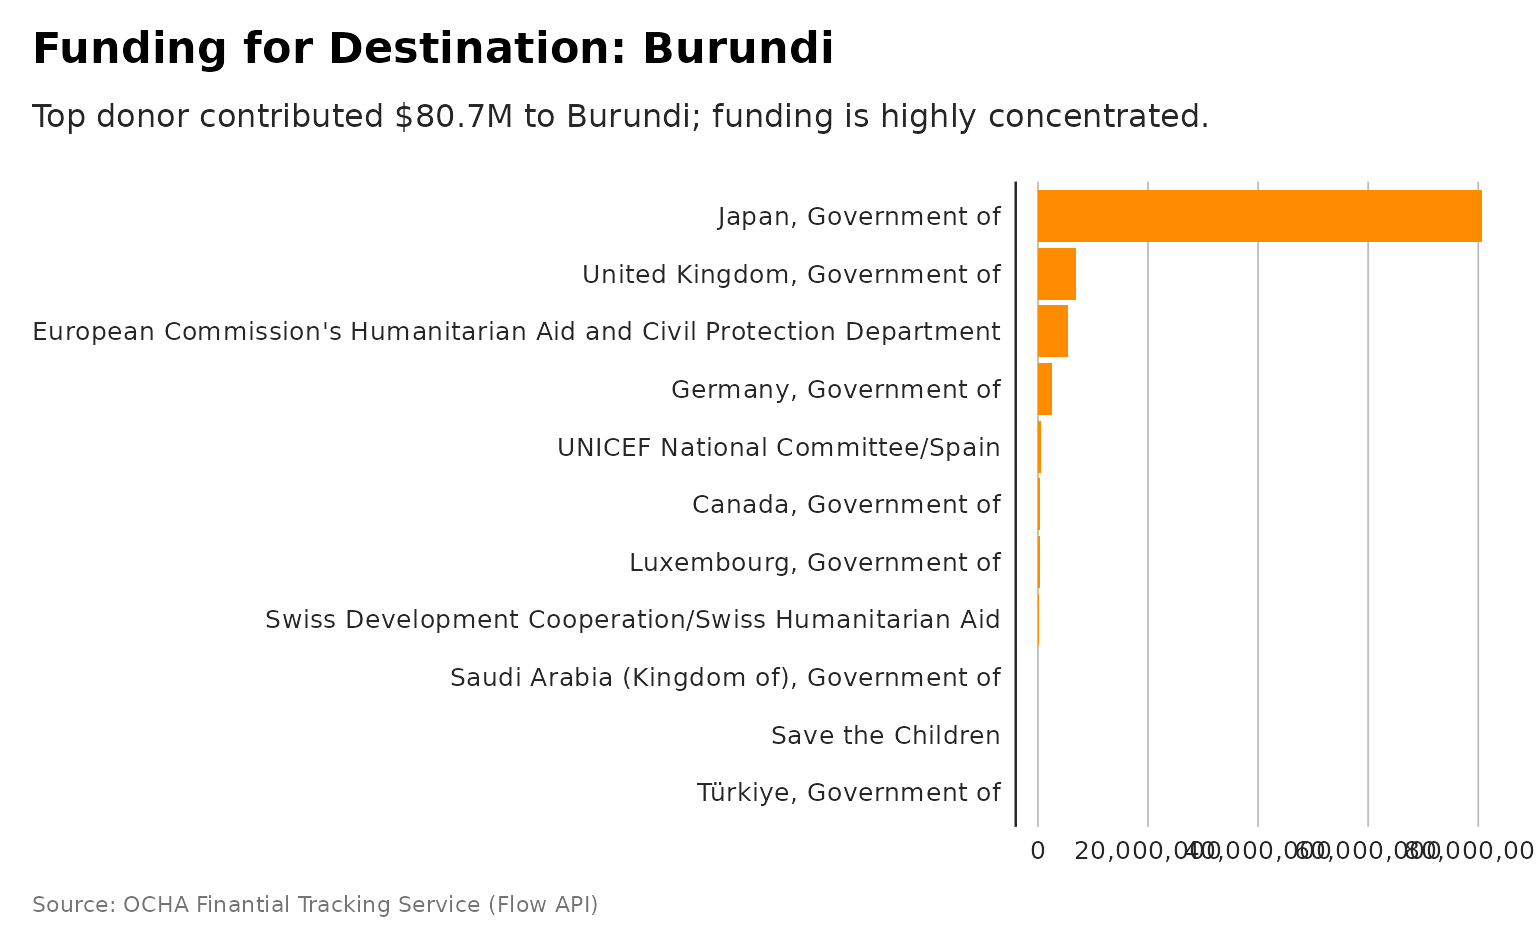
plot_destination_funding_destination
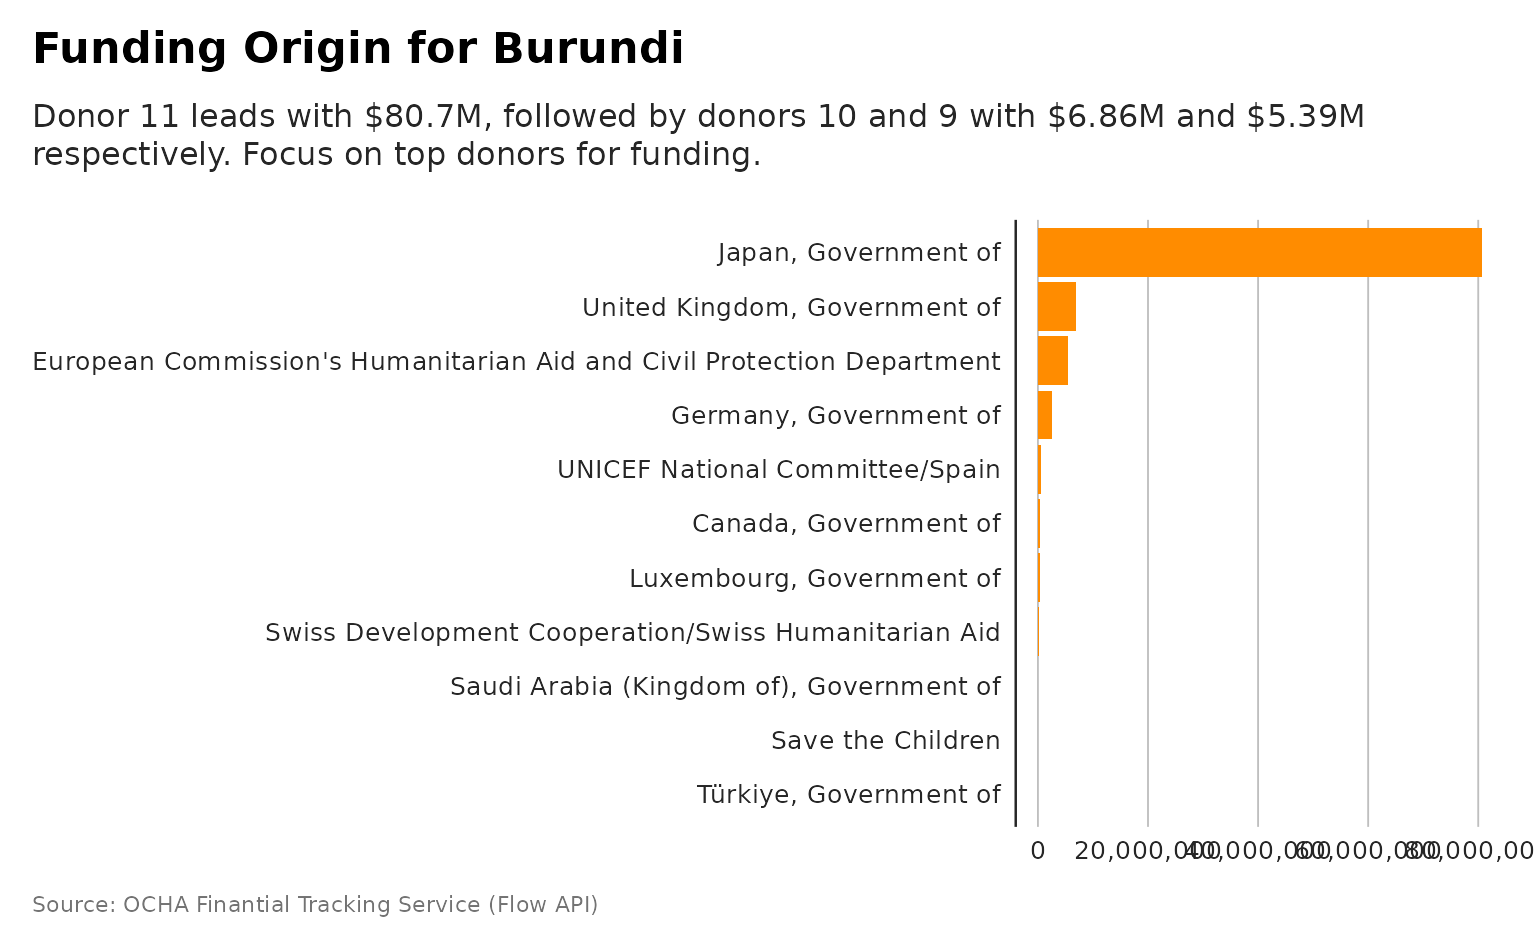
plot_destination_funding_donor
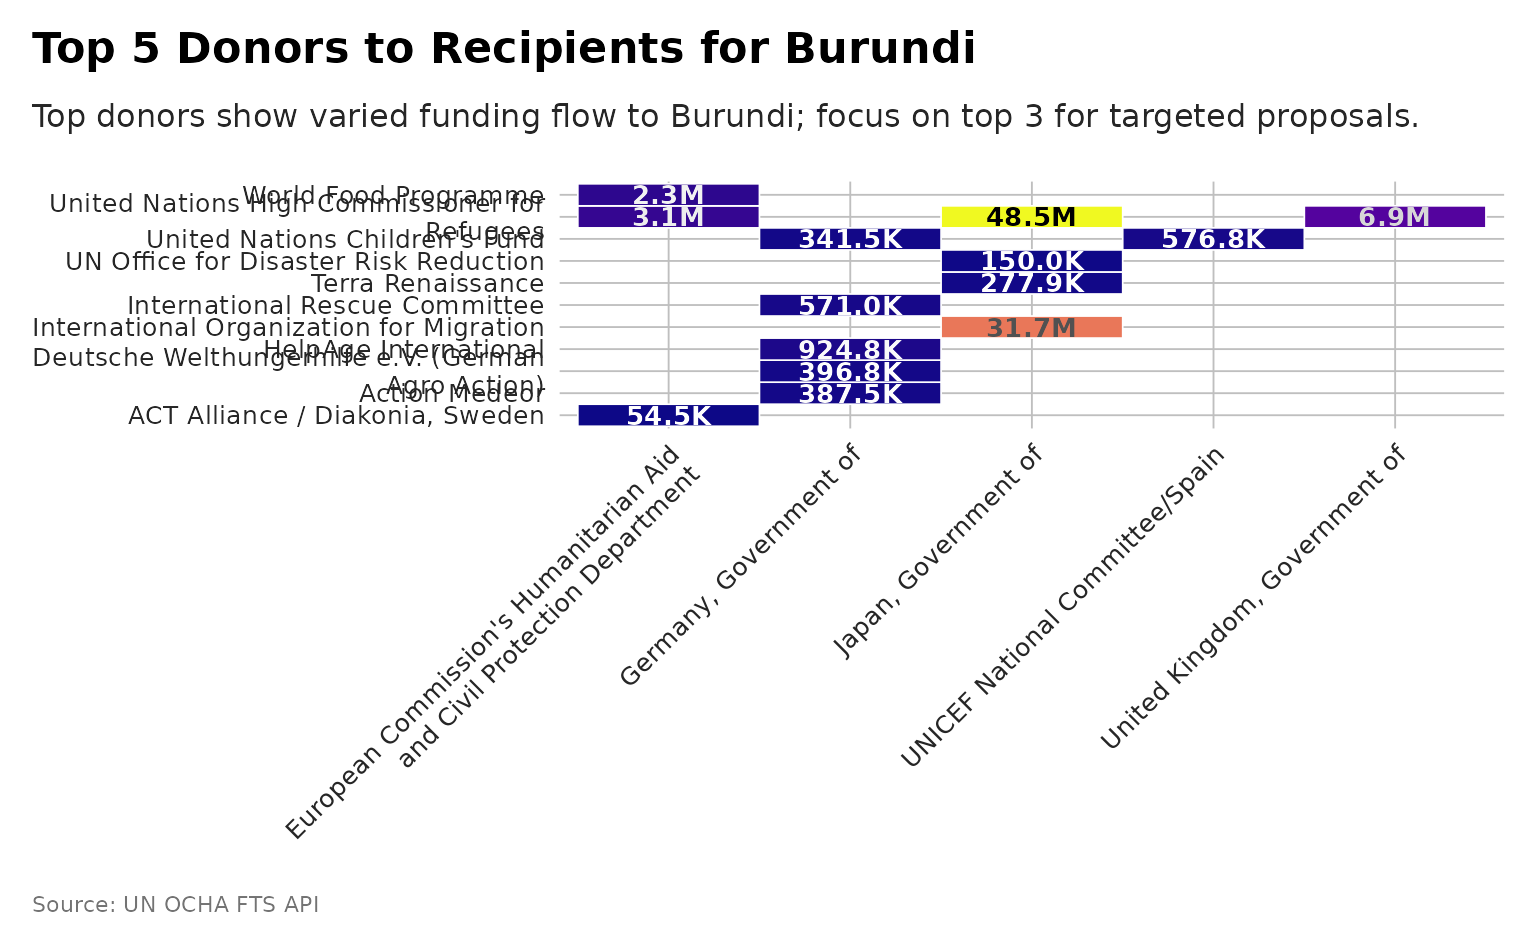
plot_destination_heatmap
Global Plot
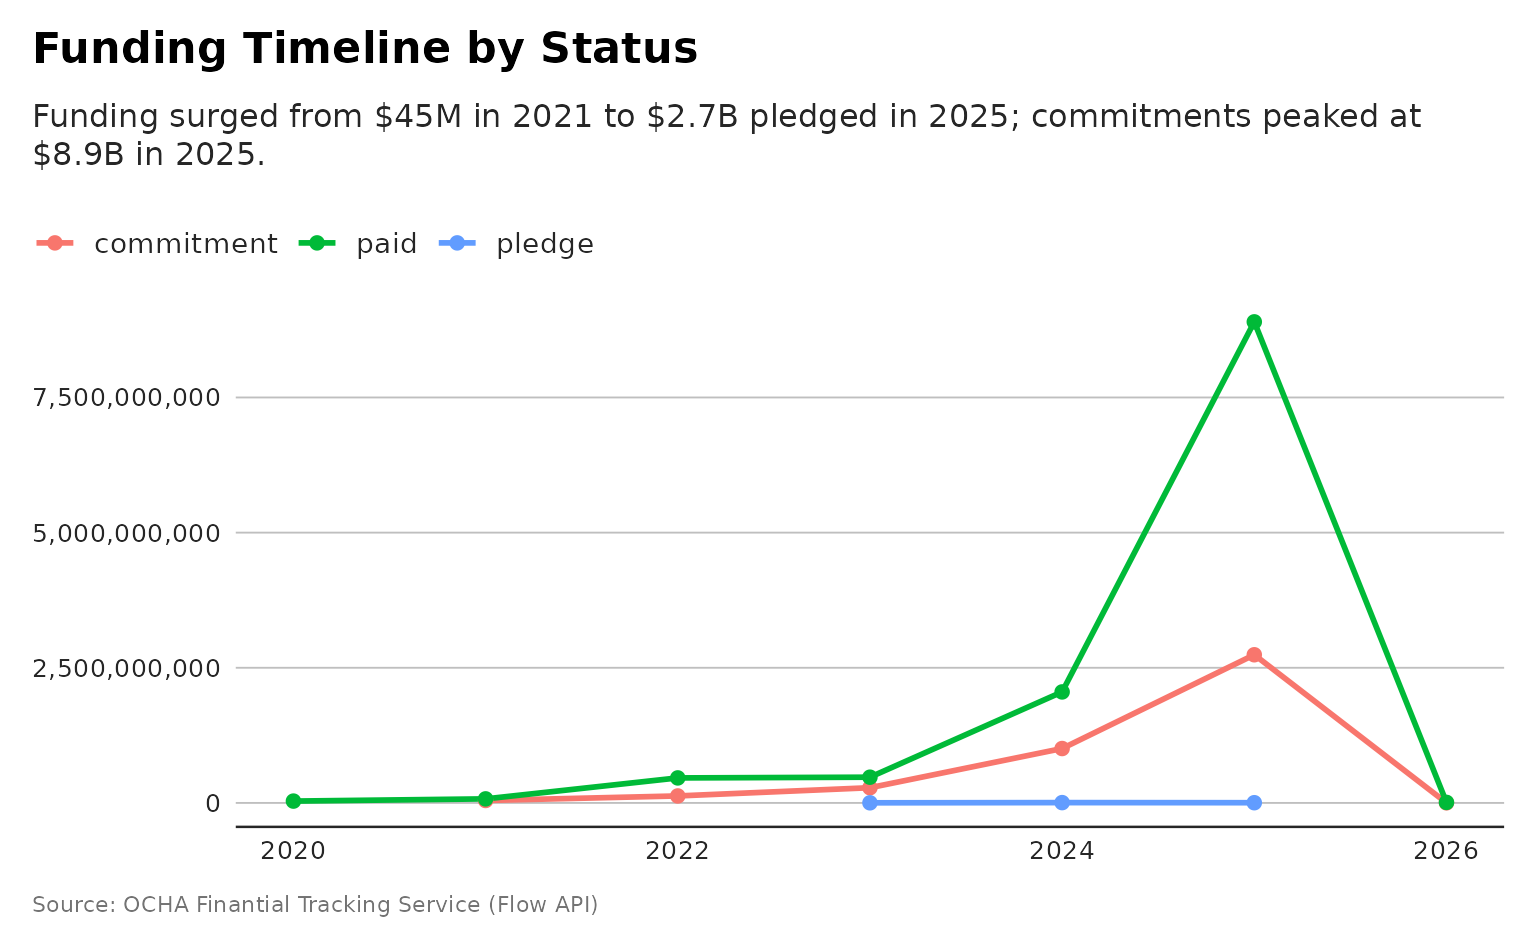
plot_funding_status_timeline