Plot Donor Funding Over Time
Source:R/plot_donor_funding_over_time.R
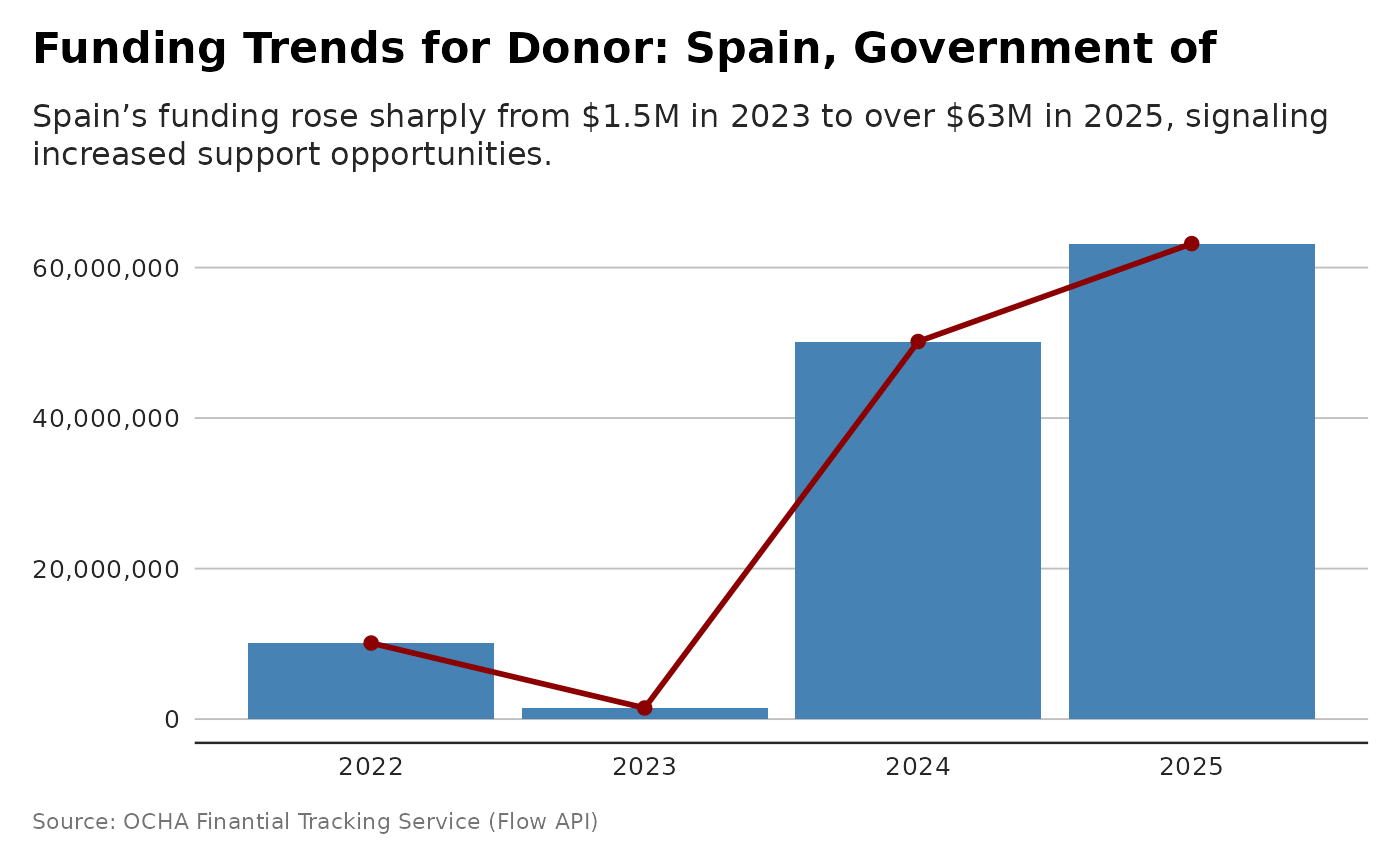
plot_donor_funding_over_time.RdVisualizes the total funding provided by a given donor across budget years. Useful to track trends, identify peaks, and assess consistency.
Examples
p <- plot_donor_funding_over_time(flows, donor_name= "Spain, Government of")
# and plot with more powerful subtitle
dubbed <- generate_plot_story(p, provider = "azure", model = "gpt-4.1-mini")
print(p + ggplot2::labs(subtitle = dubbed))