Plot Funding Timeline by Status
Source:R/plot_funding_status_timeline.R
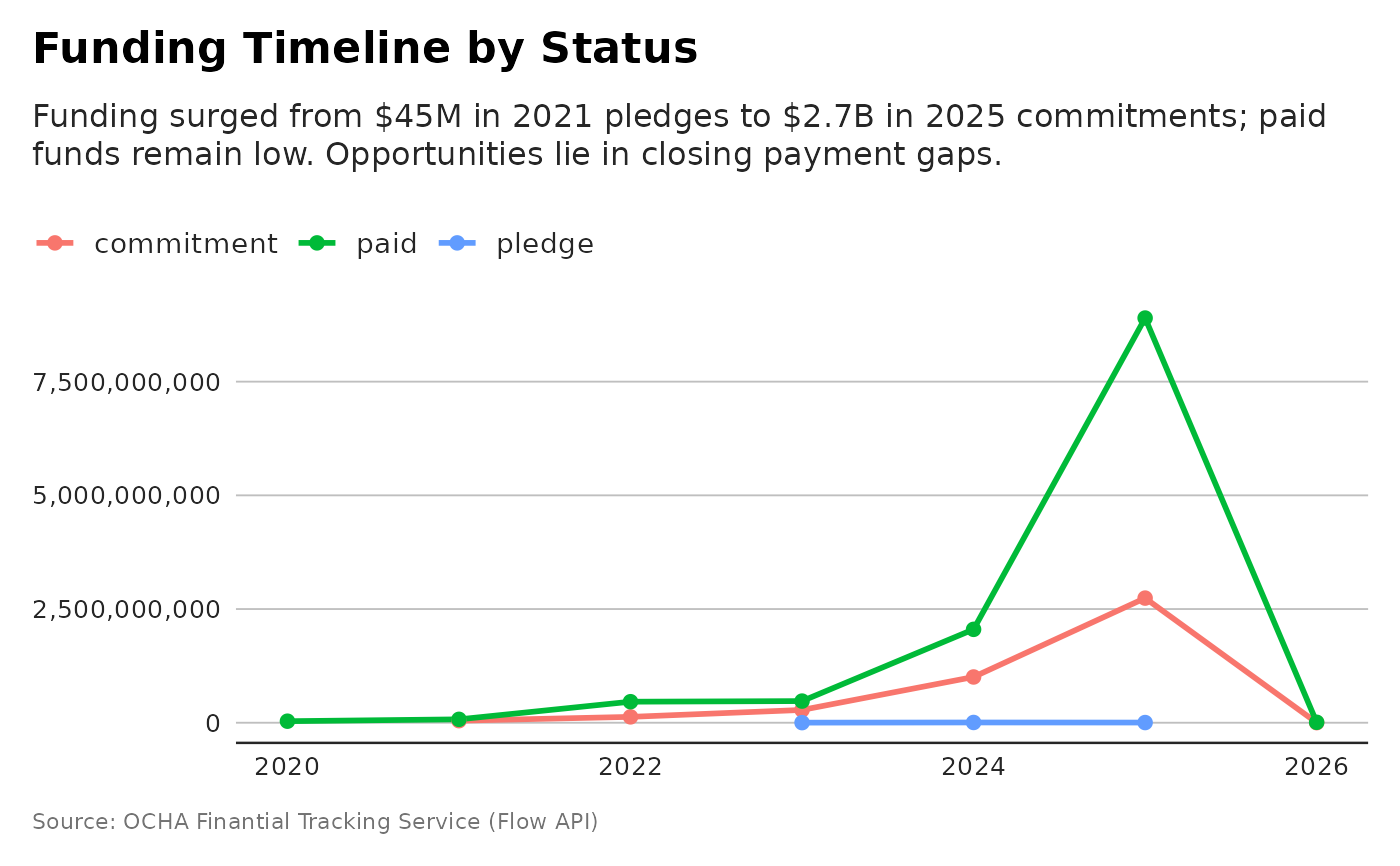
plot_funding_status_timeline.RdShows the evolution of funding amounts by status (pledge, commitment, paid) across budget years. Useful for tracking donor disbursement progress.
Examples
p <- plot_funding_status_timeline(flows)
# and plot with more powerful subtitle
dubbed <- generate_plot_story(p, provider = "azure", model = "gpt-4.1-mini")
p + ggplot2::labs(subtitle = dubbed)