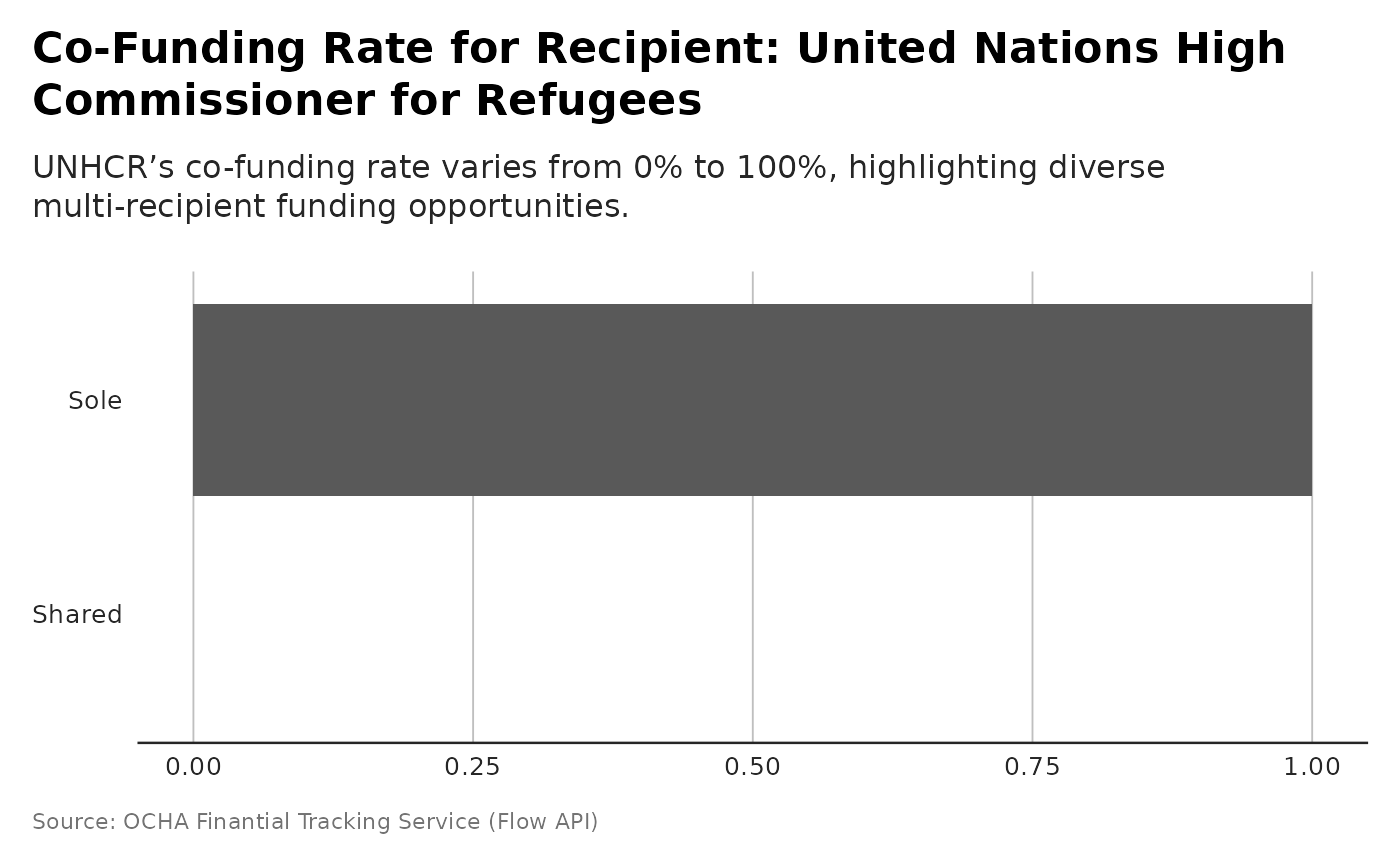
Shows how often a recipient shares funding with other recipients for a given donor. Useful to see multi-recipient funding trends.
Examples
p <- plot_recipient_cofunding(flows,
              recipient_name = "United Nations High Commissioner for Refugees")
# and plot with more powerful subtitle
dubbed <- generate_plot_story(p, provider = "azure", model = "gpt-4.1-mini")
p + ggplot2::labs(subtitle = dubbed)