Plot Funding by Destination Location
Source:R/plot_destination_funding_destination.R
plot_destination_funding_destination.RdVisualizes total humanitarian funding directed to a given destination destination. Useful to identify funding hotspots and compare regions.
Examples
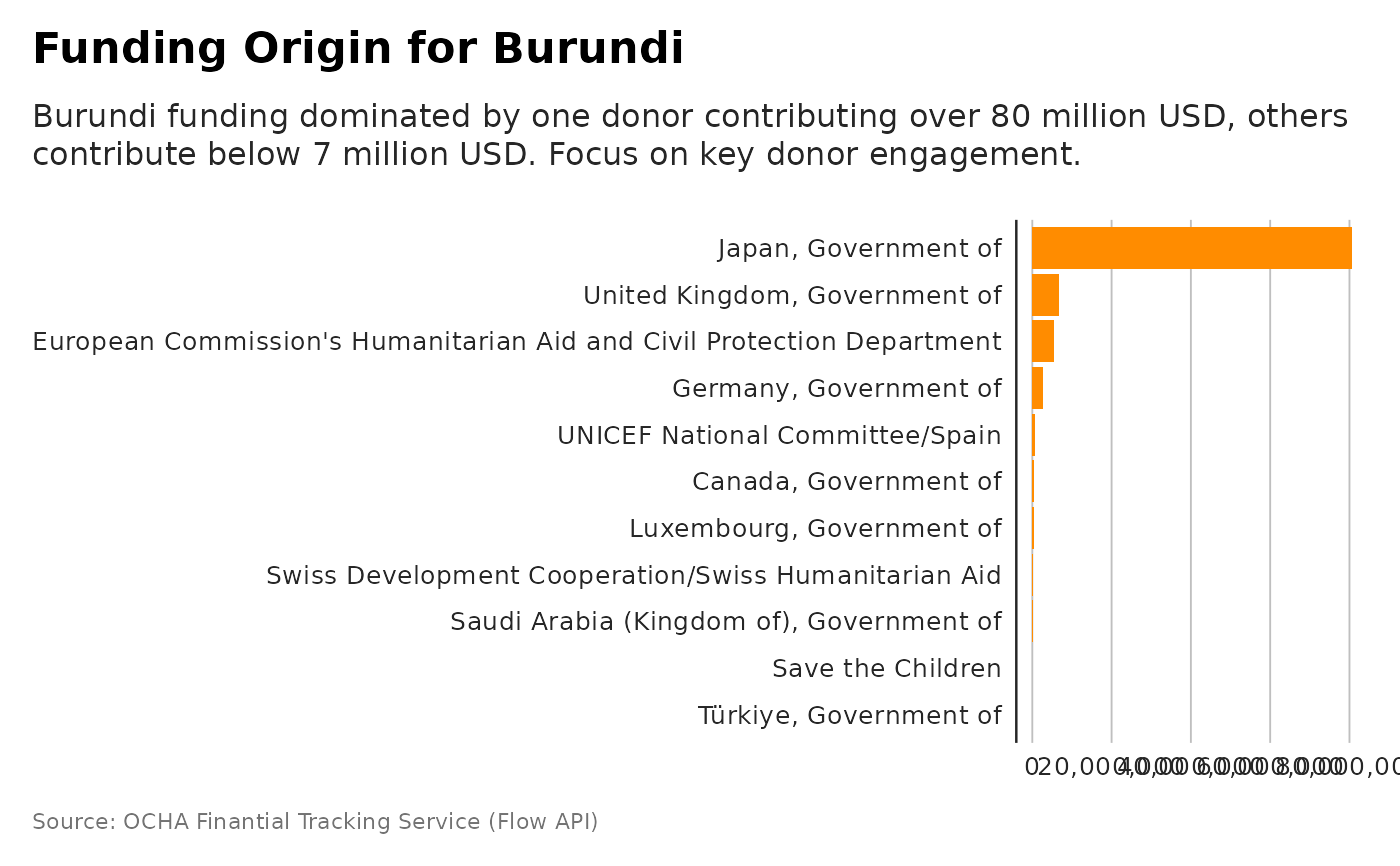
p <- plot_destination_funding_destination(flows, destination_name= "Burundi")
# and plot with more powerful subtitle
dubbed <- generate_plot_story(p, provider = "azure", model = "gpt-4.1-mini")
p + ggplot2::labs(subtitle = dubbed)