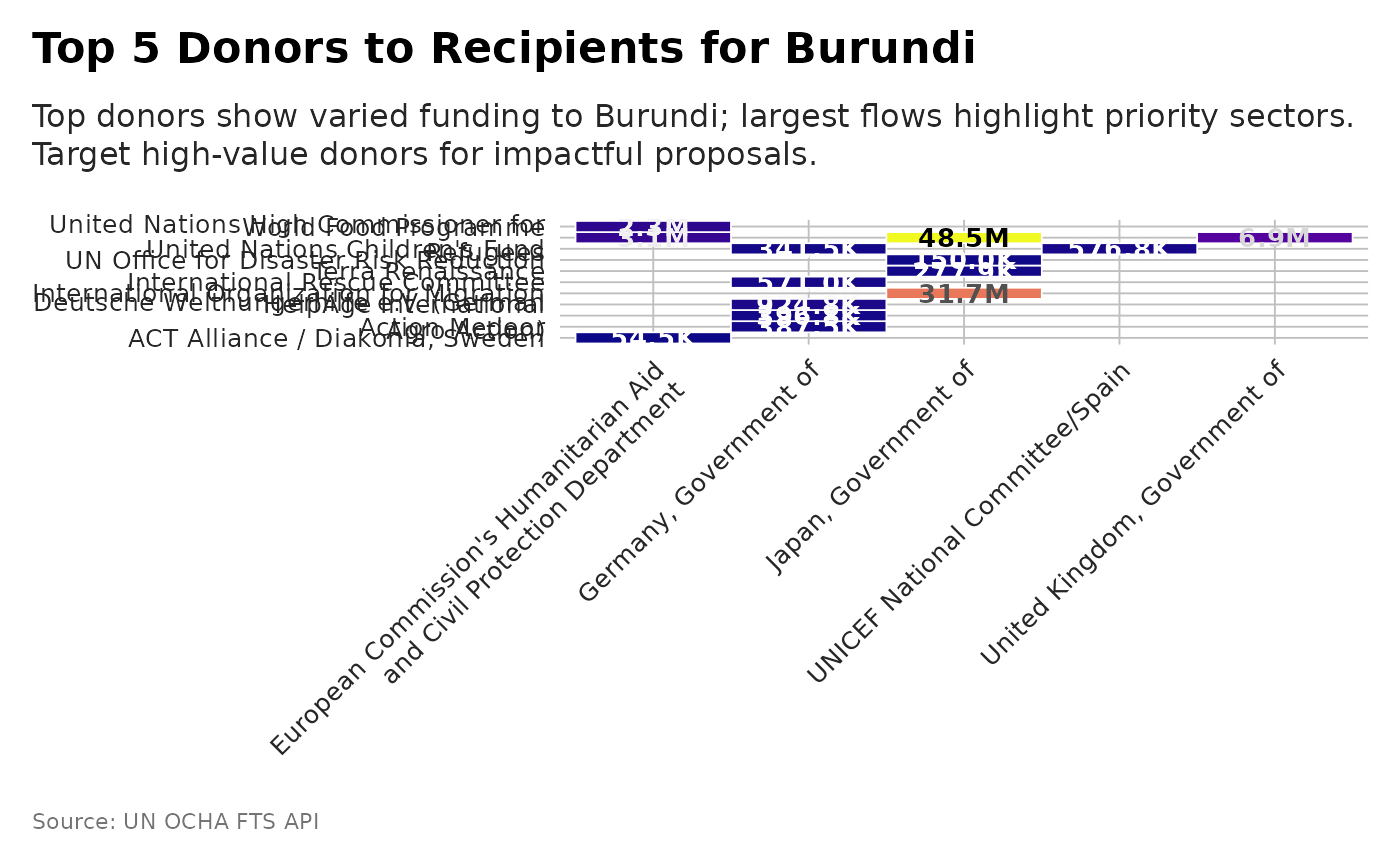
Visualizes the total funding from top donors to recipient organizations for a given destination.
Examples
p <- plot_destination_heatmap(flows, destination_name= "Burundi", top_n = 5)
# and plot with more powerful subtitle
dubbed <- generate_plot_story(p, provider = "azure", model = "gpt-4.1-mini")
p + ggplot2::labs(subtitle = dubbed)