Below is the library with all Country Focused questions organised around the 7 key questions!
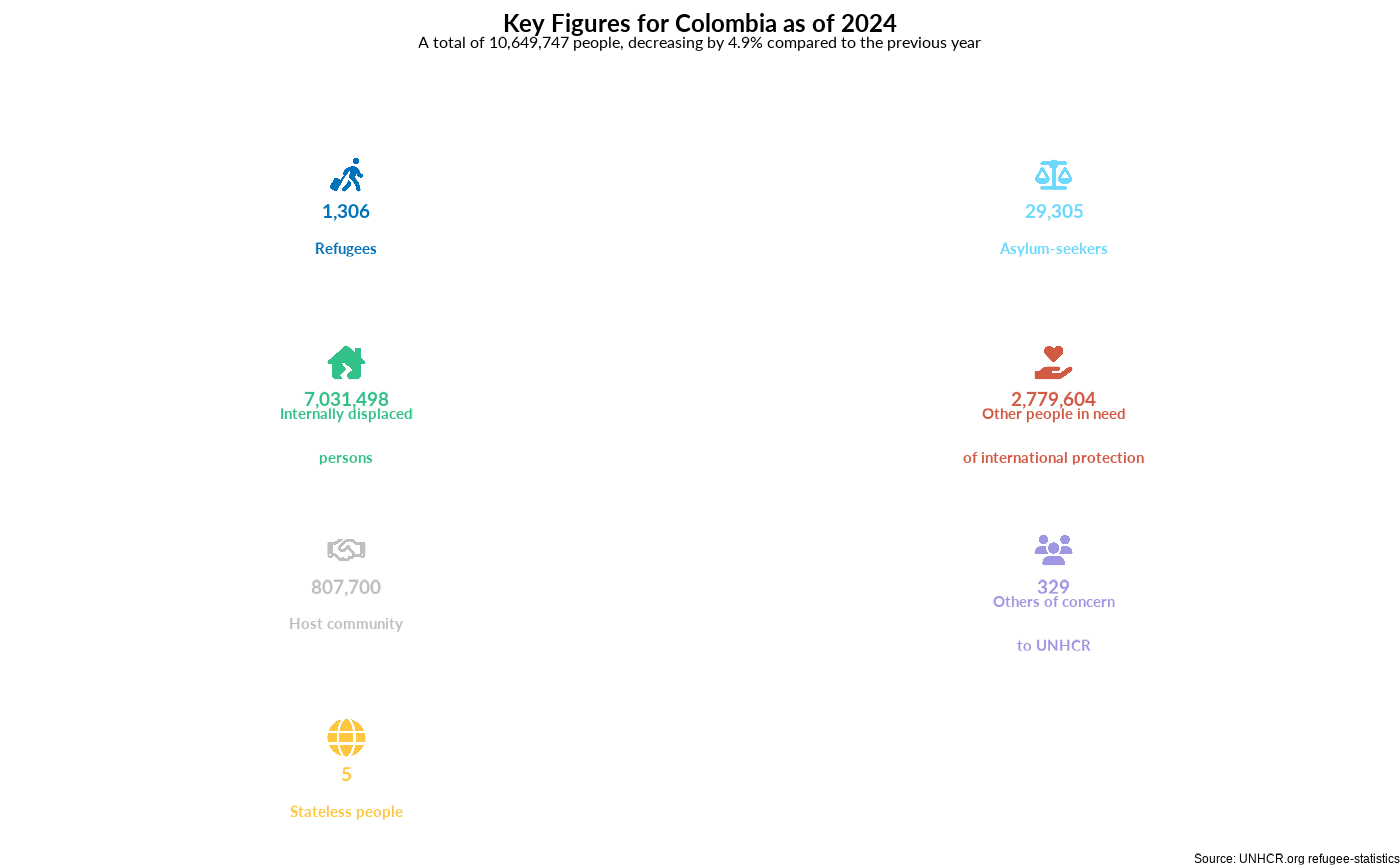
1. Category
Plot Population Type Over year
p <- plot_ctr_population_type_per_year(
  year = 2024,
  country_asylum_iso3c = "BRA",
  lag = 5,
  pop_type = c(
    "REF",
    "ASY",
    "OIP",
    "OOC",
    "STA",
    "IDP"
  )
)
p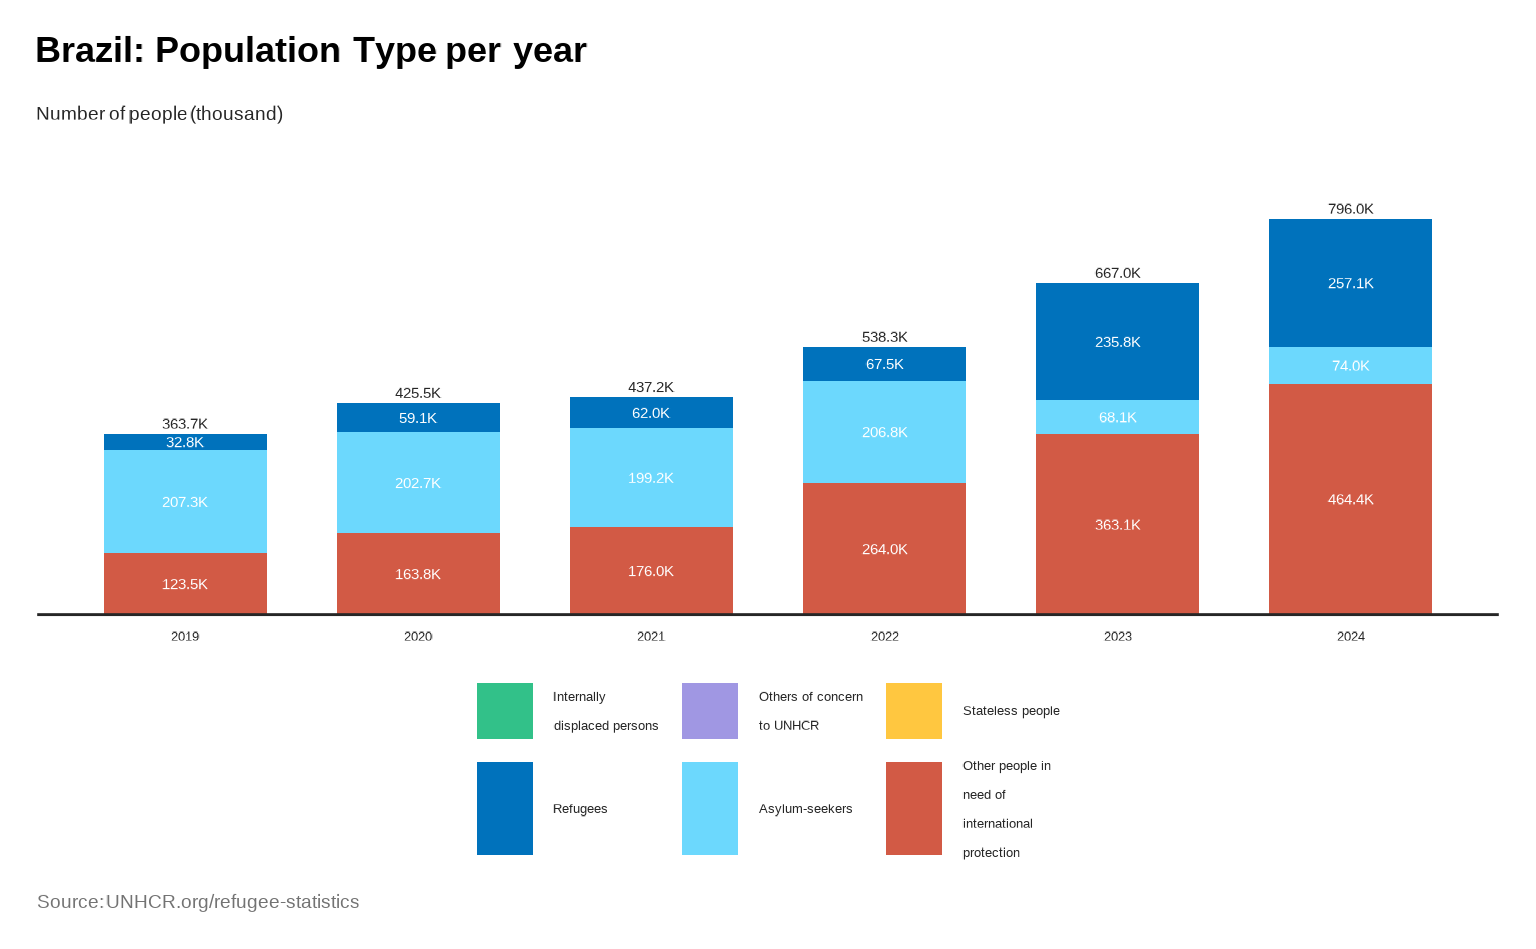
## Raw data can always be accessed with
# knitr::kable(ggplot2::ggplot_build(p)$plot$data )
2. Origin
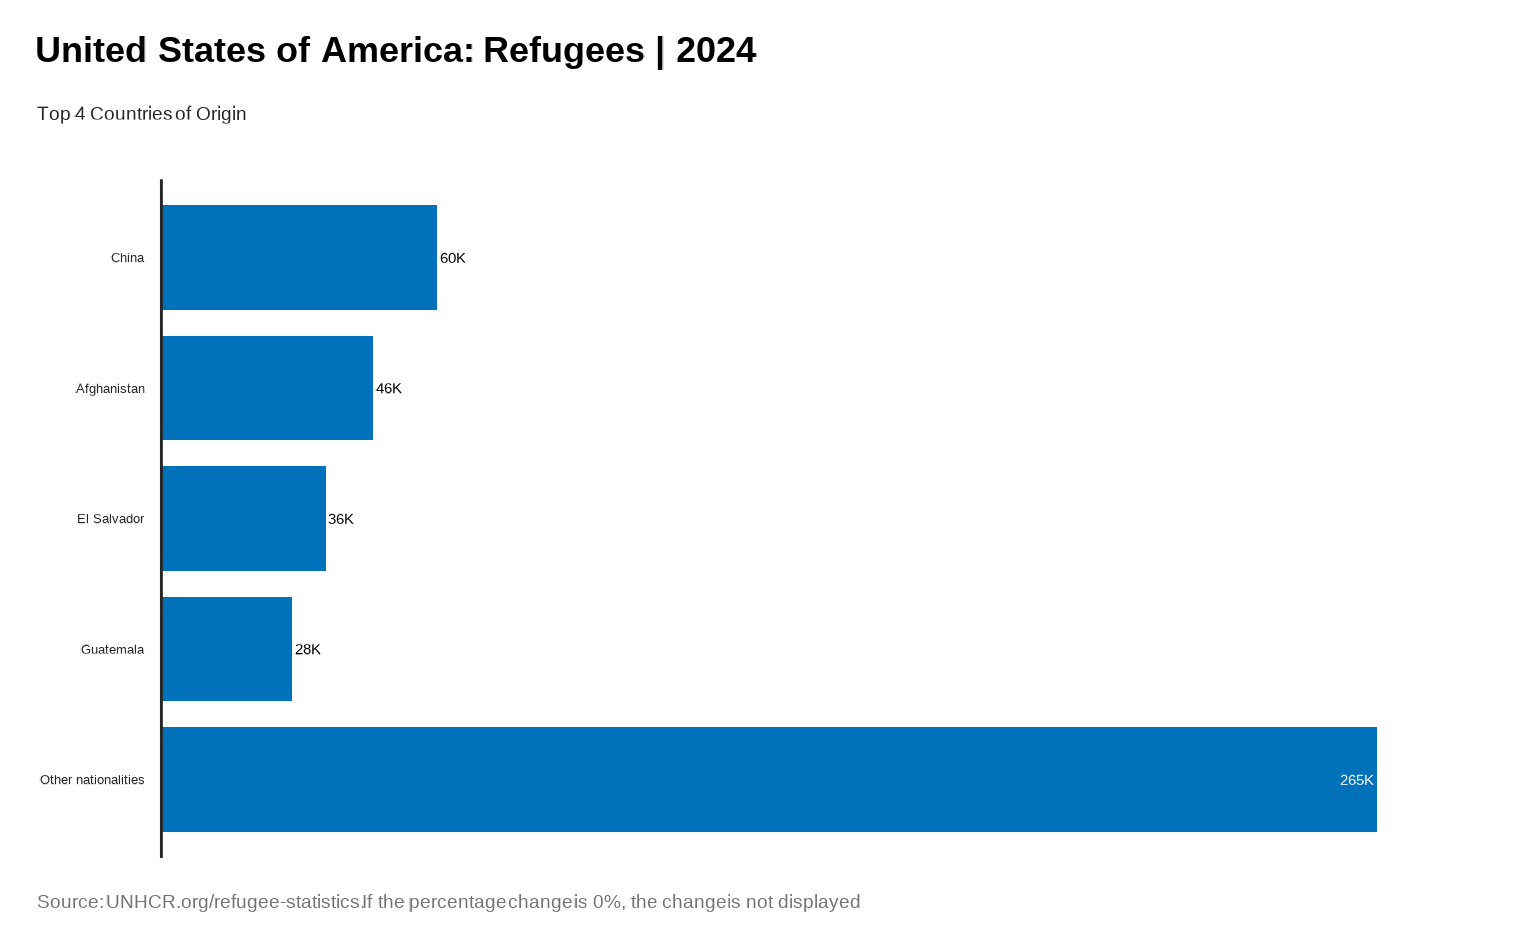
Plot Main country of origin in one specific country - Absolute value
plot_ctr_population_type_abs(
  year = 2024,
  country_asylum_iso3c = "USA",
  top_n_countries = 4,
  pop_type = "REF",
  show_diff_label = FALSE
)
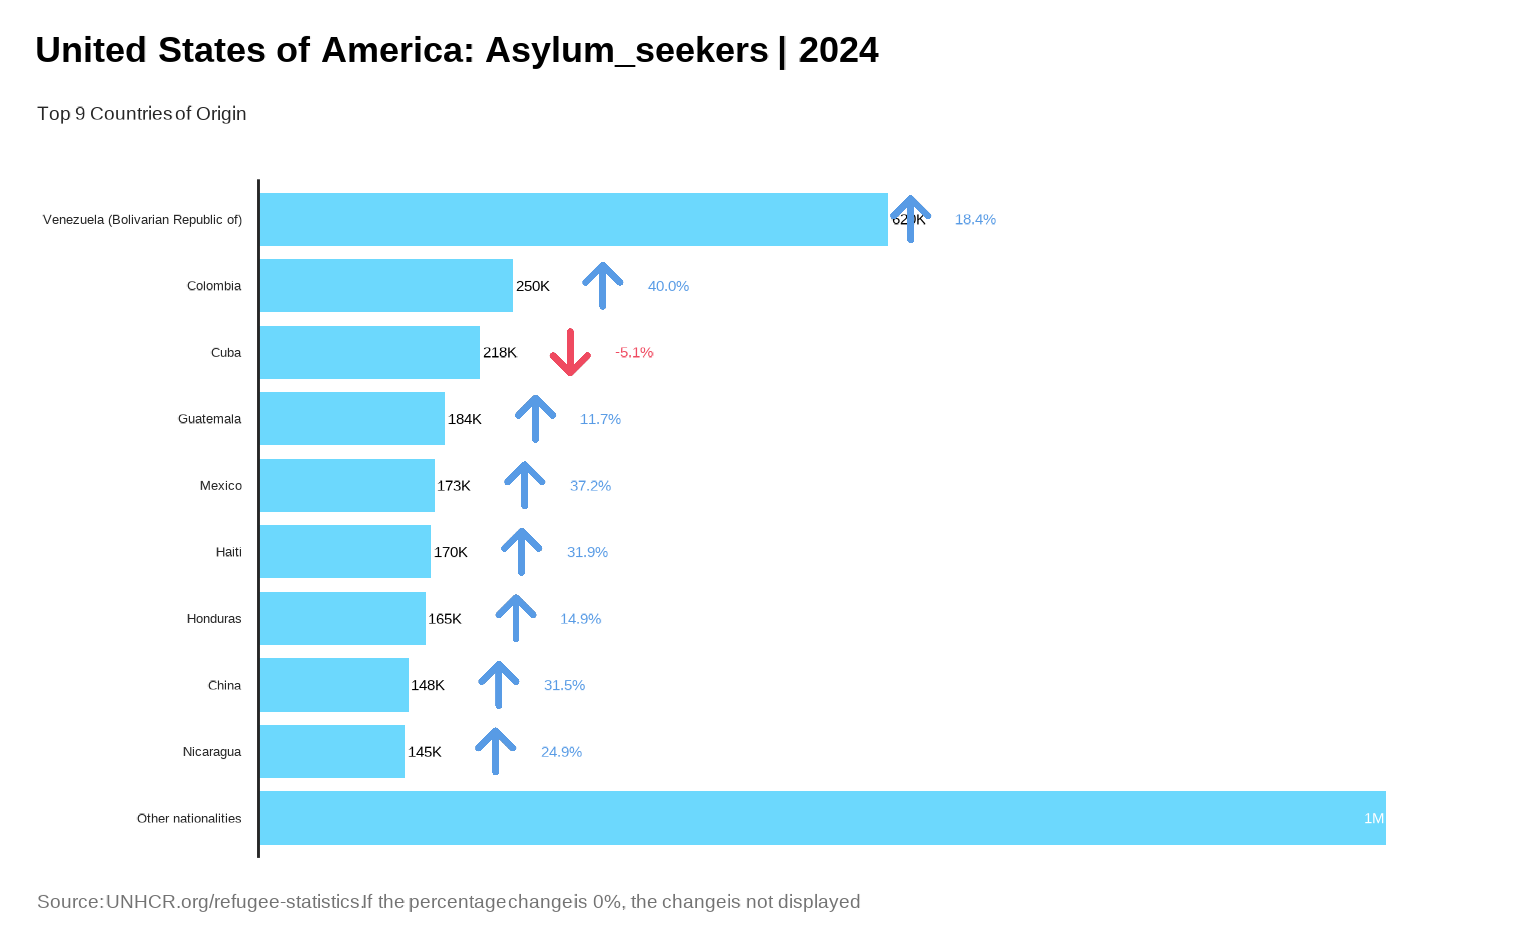
## Same with 9 top countries and Asylum-seekers included
plot_ctr_population_type_abs(
  year = 2024,
  country_asylum_iso3c = "USA",
  top_n_countries = 9,
  pop_type = "ASY",
  show_diff_label = TRUE
)
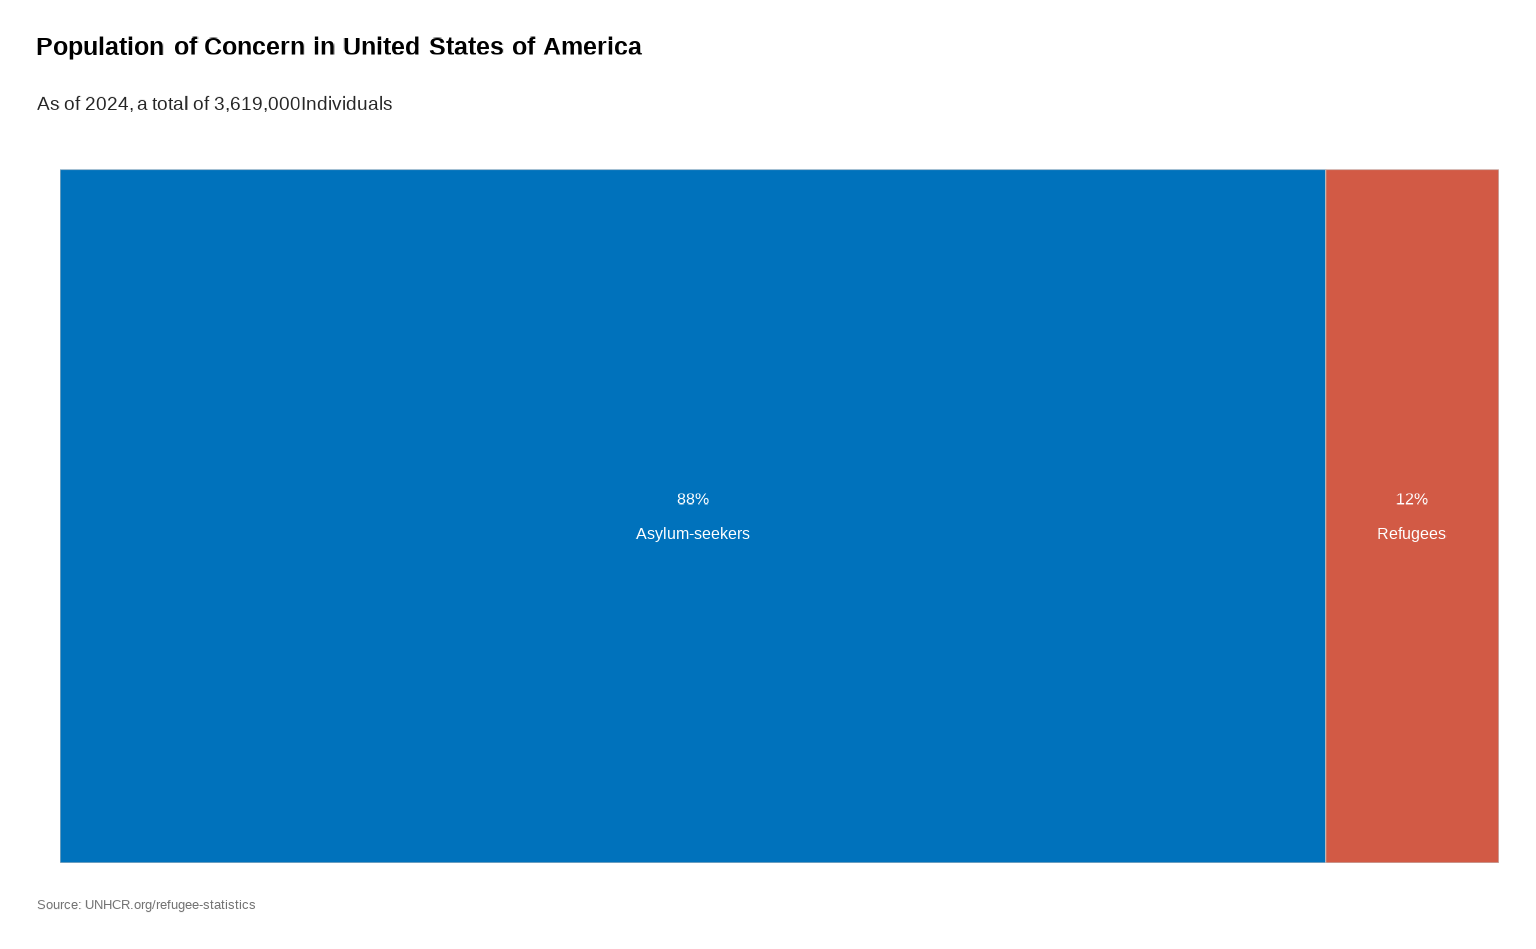
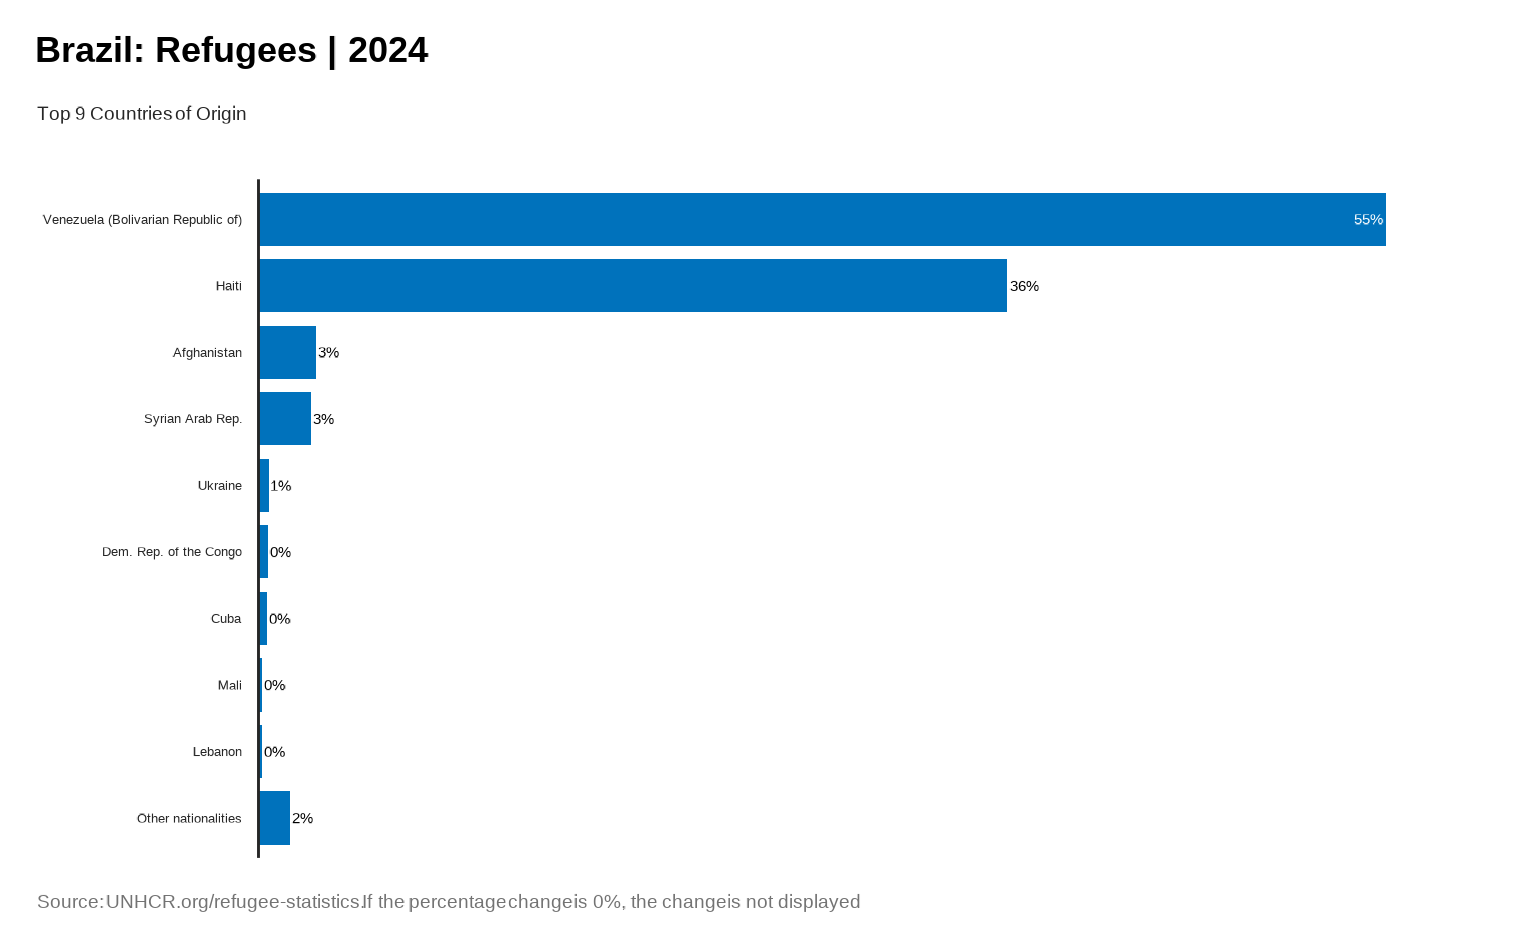
Plot Main country of origin in one specific country - Percentage
plot_ctr_population_type_perc(
  year = 2024,
  country_asylum_iso3c = "BRA",
  top_n_countries = 9,
  pop_type = "REF",
  show_diff_label = FALSE
)
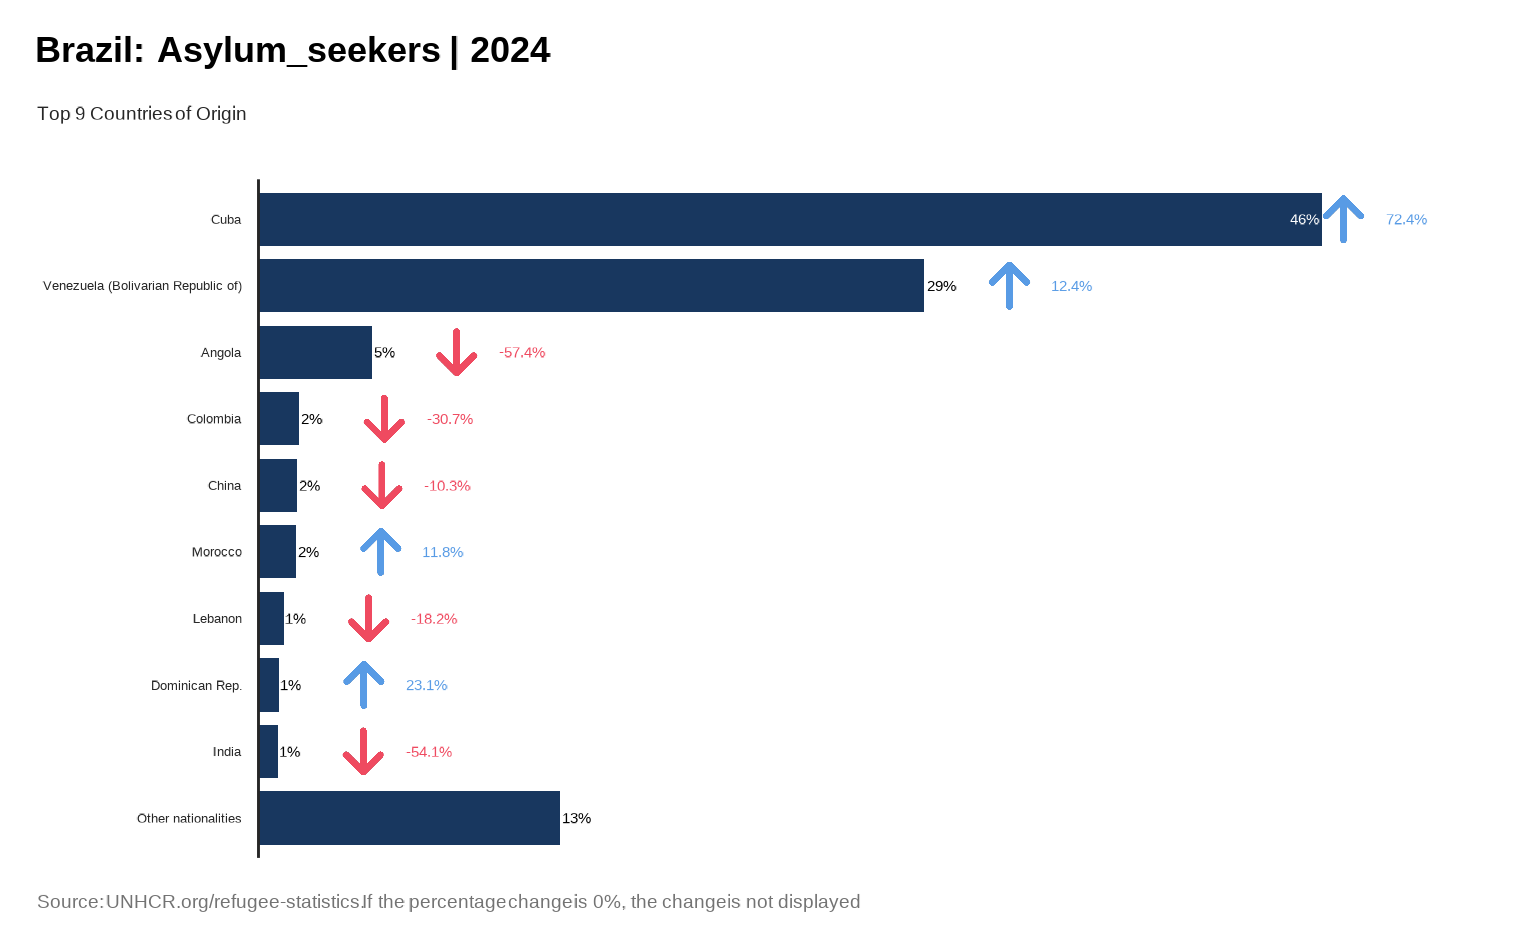
plot_ctr_population_type_perc(
  year = 2024,
  country_asylum_iso3c = "BRA",
  top_n_countries = 9,
  pop_type = "ASY",
  show_diff_label = TRUE
)
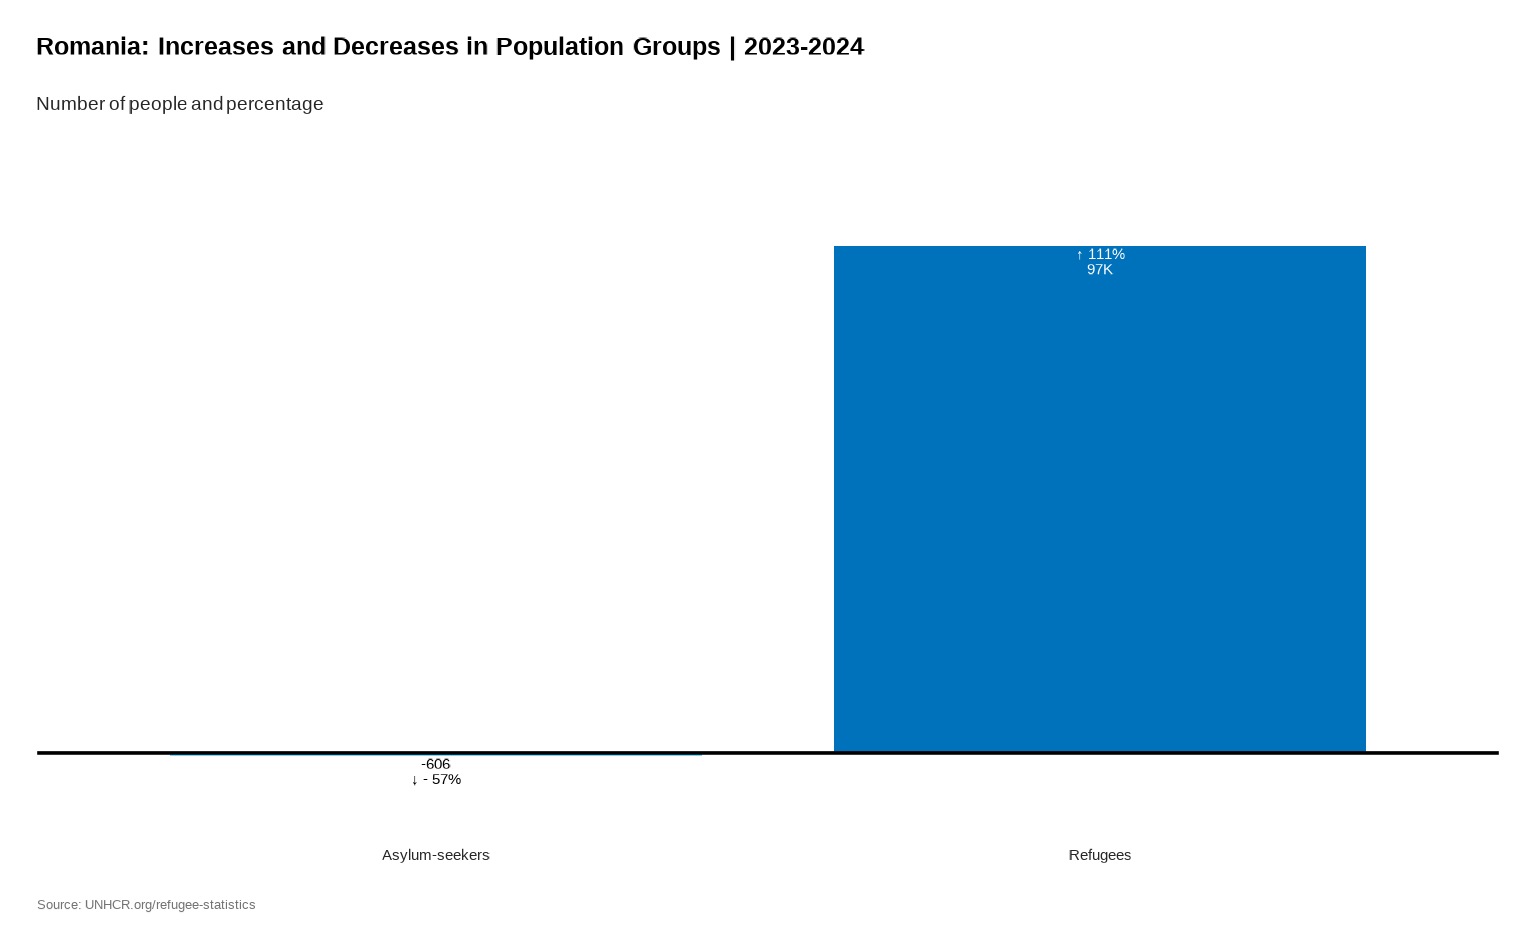
Plot Increases and Decreases in Population Groups
#
plot_ctr_diff_in_pop_groups(
  year = 2024,
  country_asylum_iso3c = "ROU",
  pop_type = c("REF", "ASY")
)
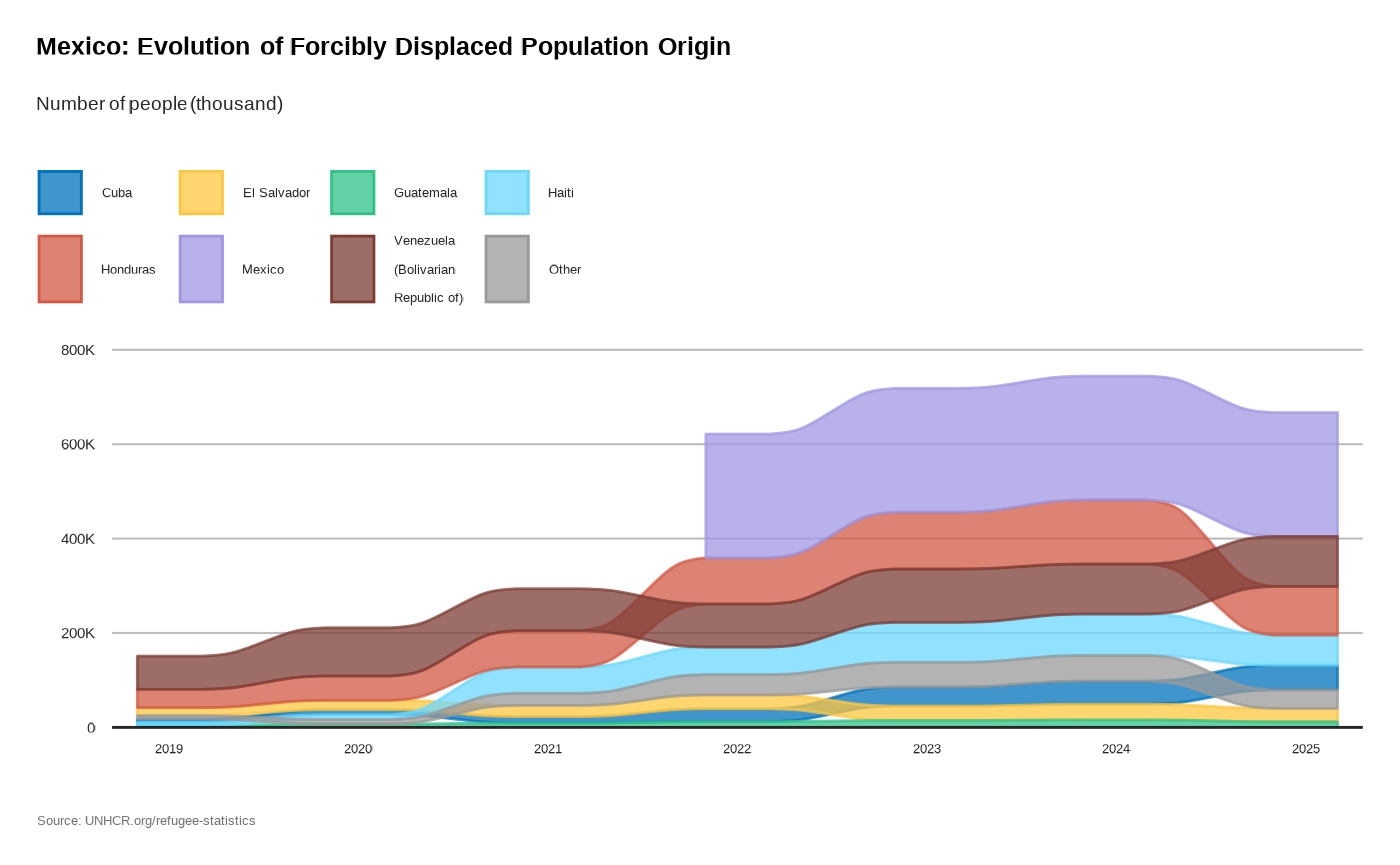
Plot Origin History
plot_ctr_origin_history(
  year = 2024,
  lag = 5,
  country_asylum_iso3c = "MEX",
  pop_type = c(
    "REF",
    "ASY",
    "OIP",
    "IDP"
  ),
  otherprop = .02
)
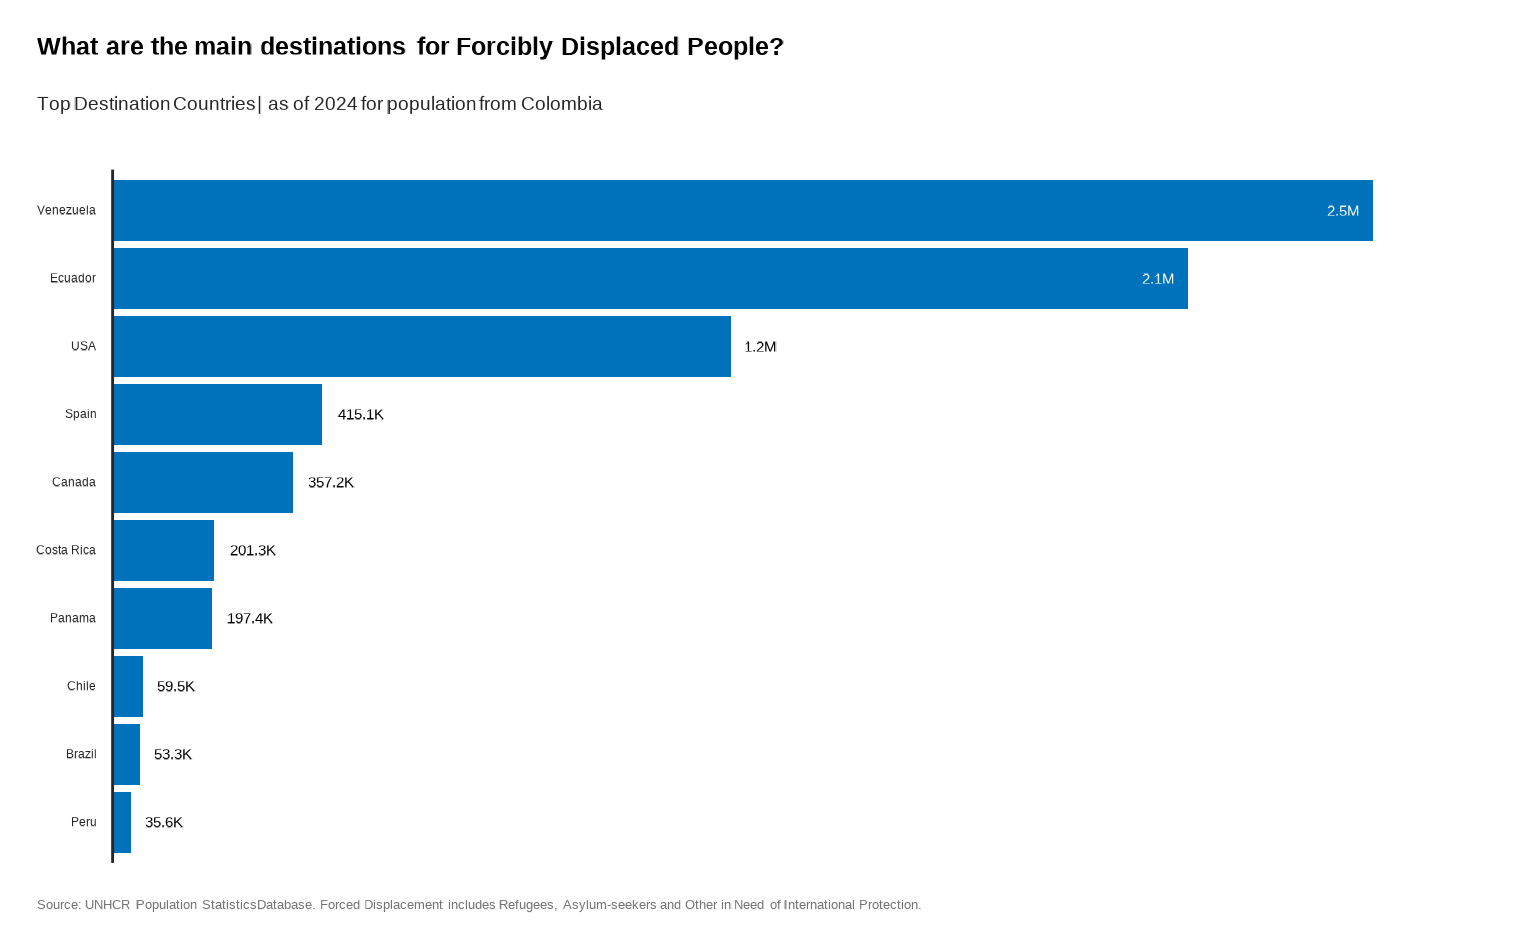
3. Destination
Plot Main Destination from one specific country
#
plot_ctr_destination(
  year = 2024,
  country_origin_iso3c = "COL",
  pop_type = c("REF", "ASY")
)
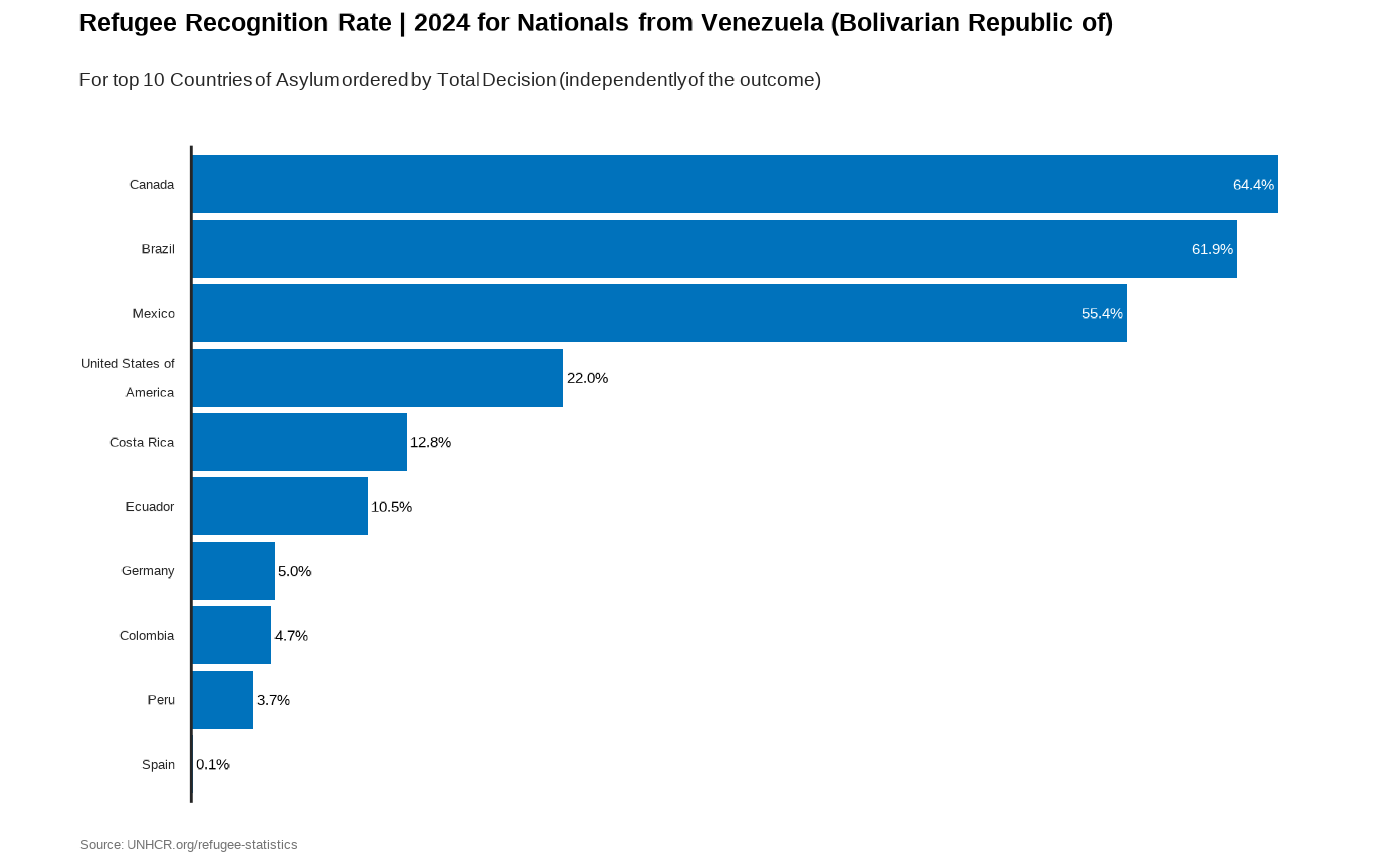
plot recognition rate for a nationality
plot_ctr_origin_recognition(
  year = 2024,
  country_origin_iso3c = "VEN",
  top_n_countries = 10,
  measure = "RefugeeRecognitionRate",
  order_by = "TotalDecided"
)
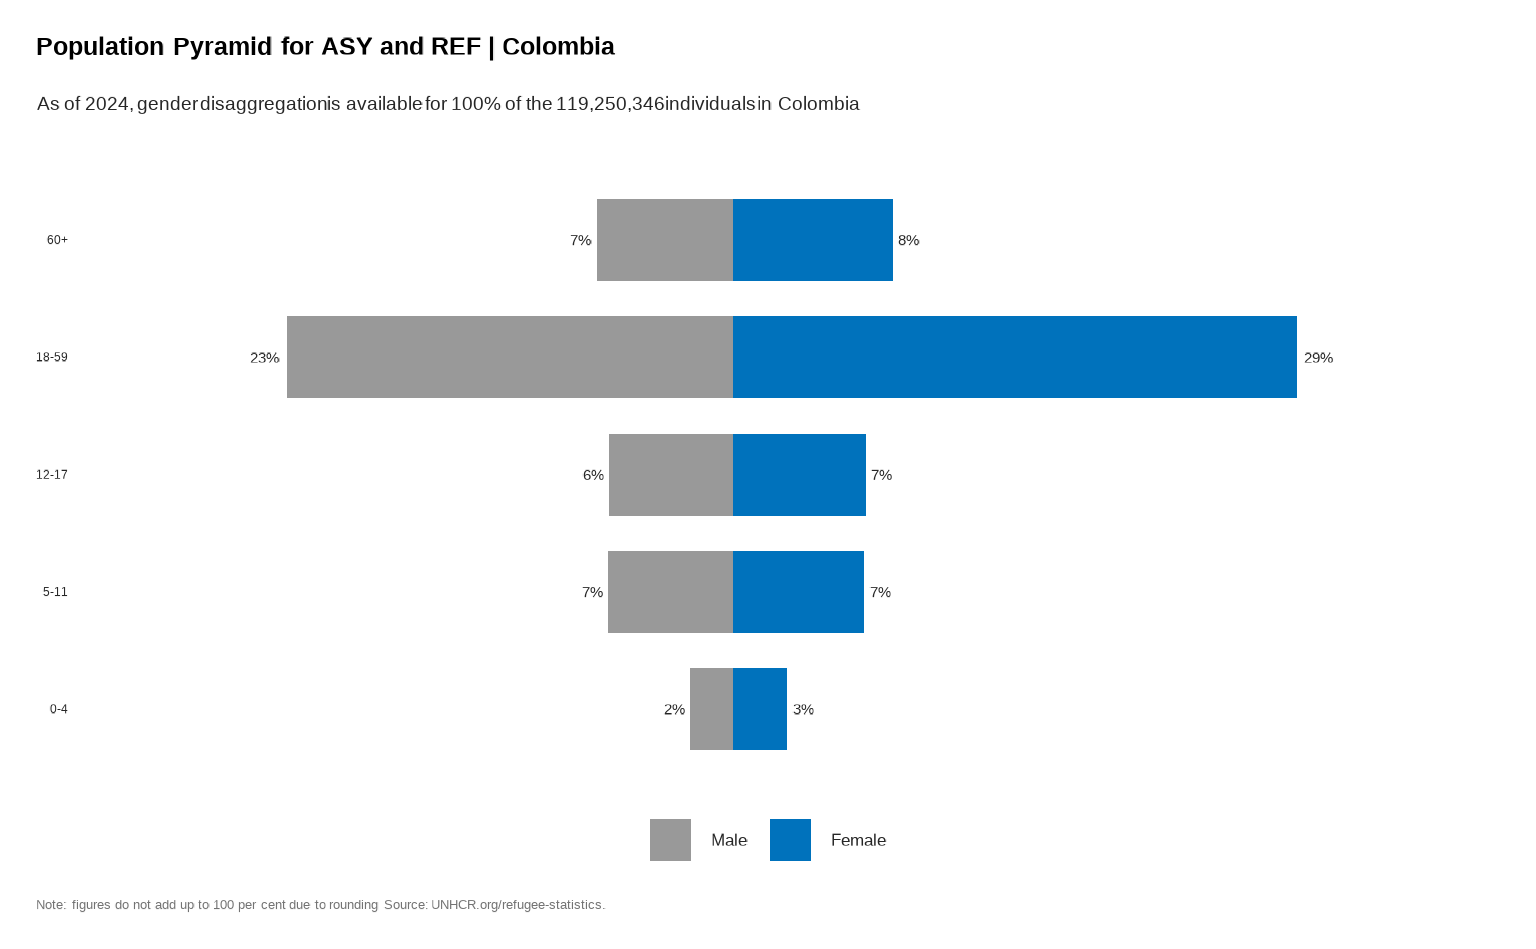
4. Profile
Plot Age Pyramid
#
plot_ctr_pyramid(
  year = 2024,
  country_asylum_iso3c = "COL",
  pop_type = c("ASY", "REF")
)
Plot locations within countries
# plot_ctr_location(year = 2024,
#                  country_asylum_iso3c = "COL",
#                  pop_type = c("ASY", "REF", "OIP"))
#
# plot_ctr_location(year = 2024,
#                  country_asylum_iso3c = "COL",
#                  pop_type = c("IDP"))
#
# plot_ctr_location(year = 2024,
#                  country_asylum_iso3c = "CAN",
#                  pop_type = c("ASY", "REF", "OIP"))
#
# plot_ctr_location(year = 2024,
#                  country_asylum_iso3c = "MEX",
#                  pop_type = c("ASY", "REF", "OIP"))
5. Processing
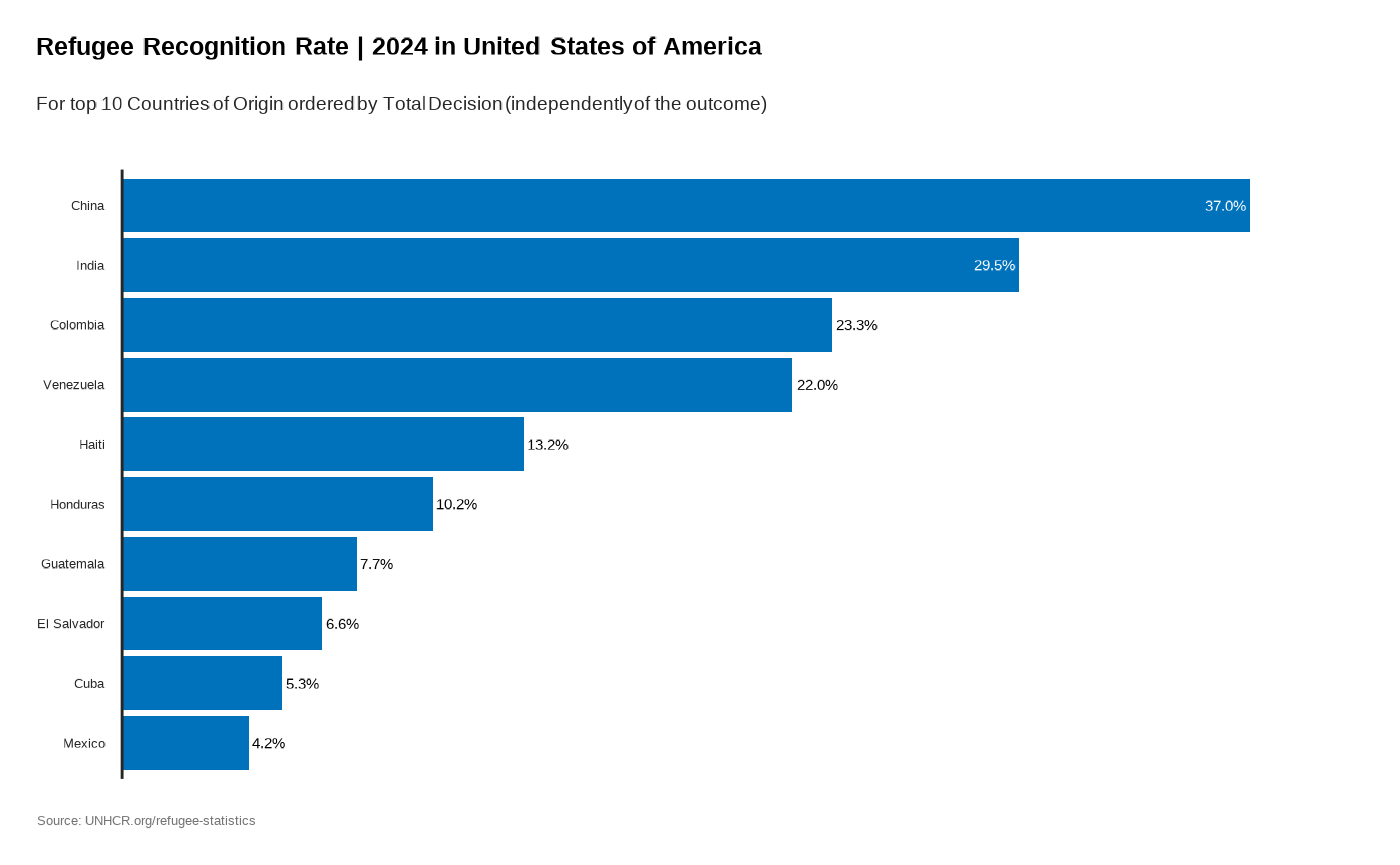
Plot Refugee Recognition rate in Country
plot_ctr_recognition(
  year = 2024,
  country_asylum_iso3c = "USA",
  top_n_countries = 10,
  measure = "RefugeeRecognitionRate",
  order_by = "TotalDecided"
)
5. Processing
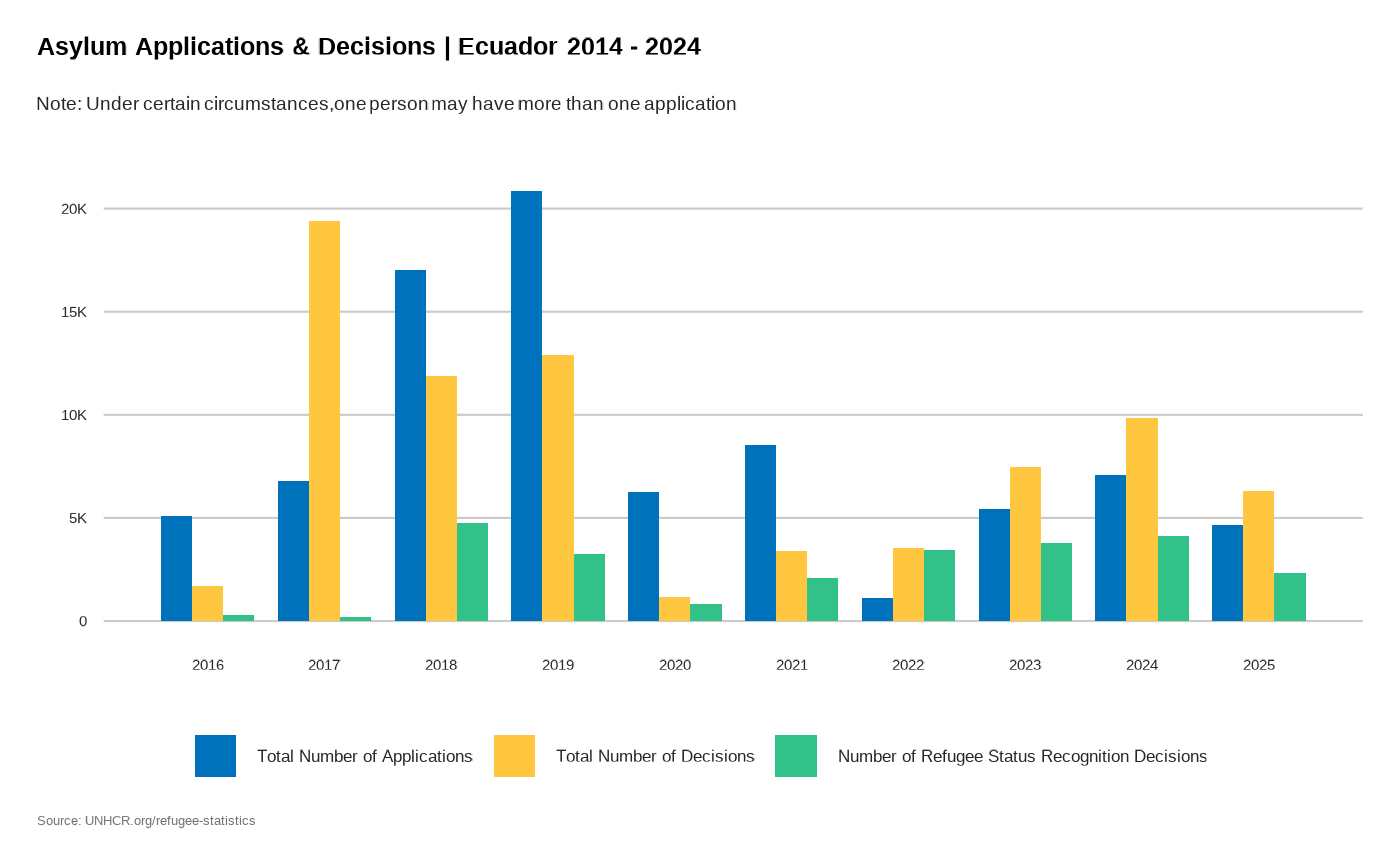
Asylum Applications & Decision over time
plot_ctr_asylum(
  year = 2024,
  country_asylum_iso3c = "ECU",
  lag = 10
)
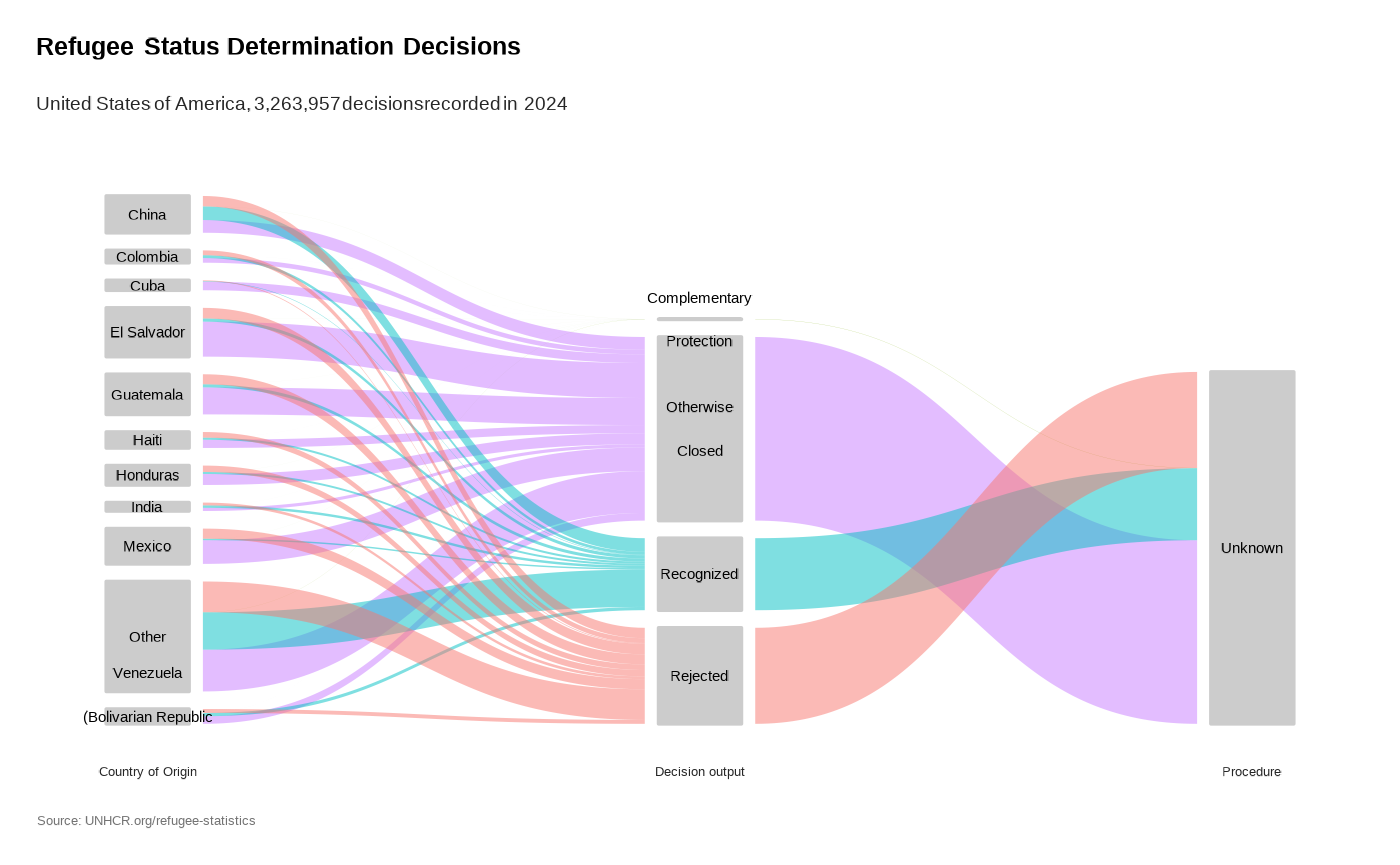
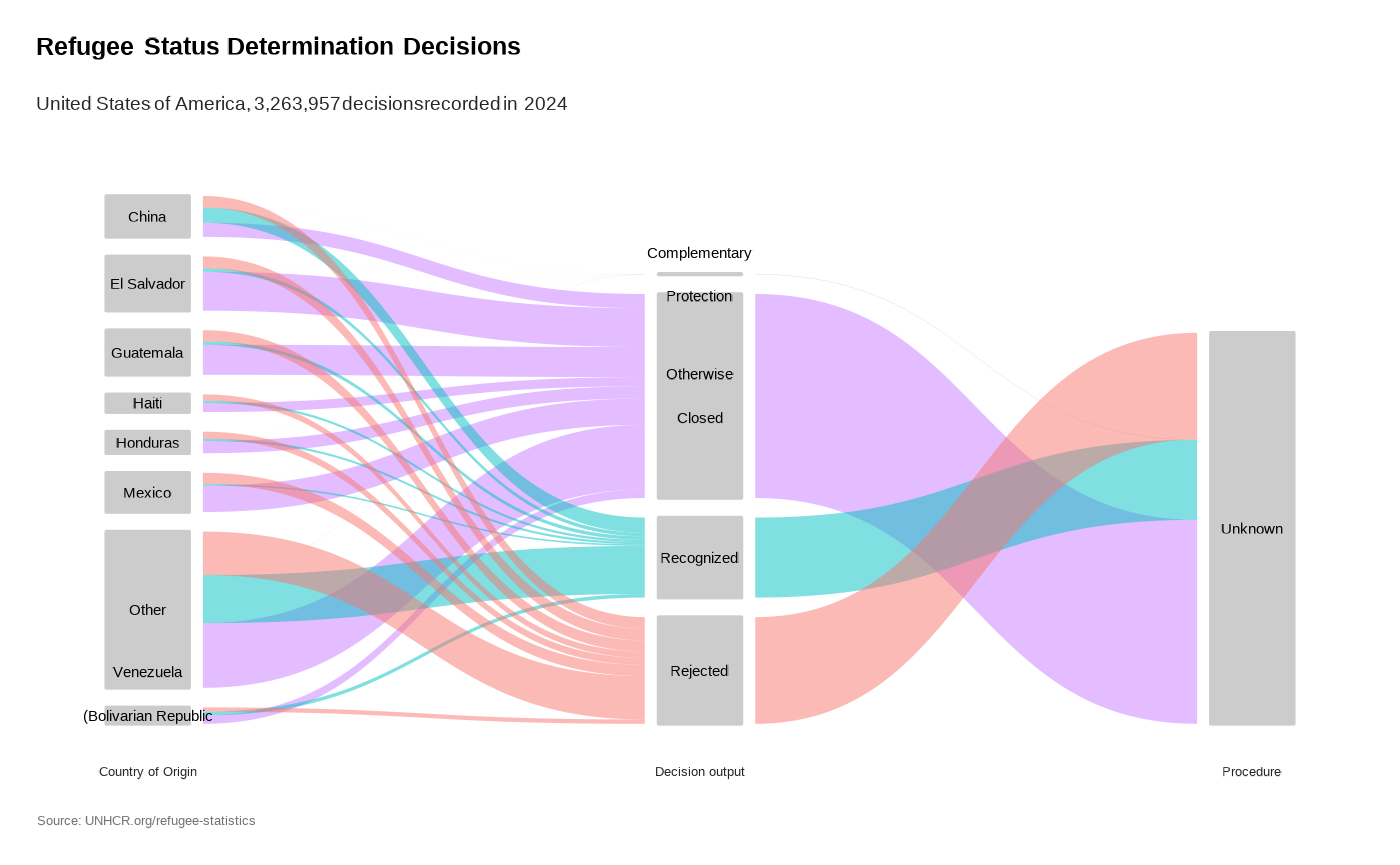
Asylum Processing
plot_ctr_process(year = 2024, country_asylum_iso3c = "BOL")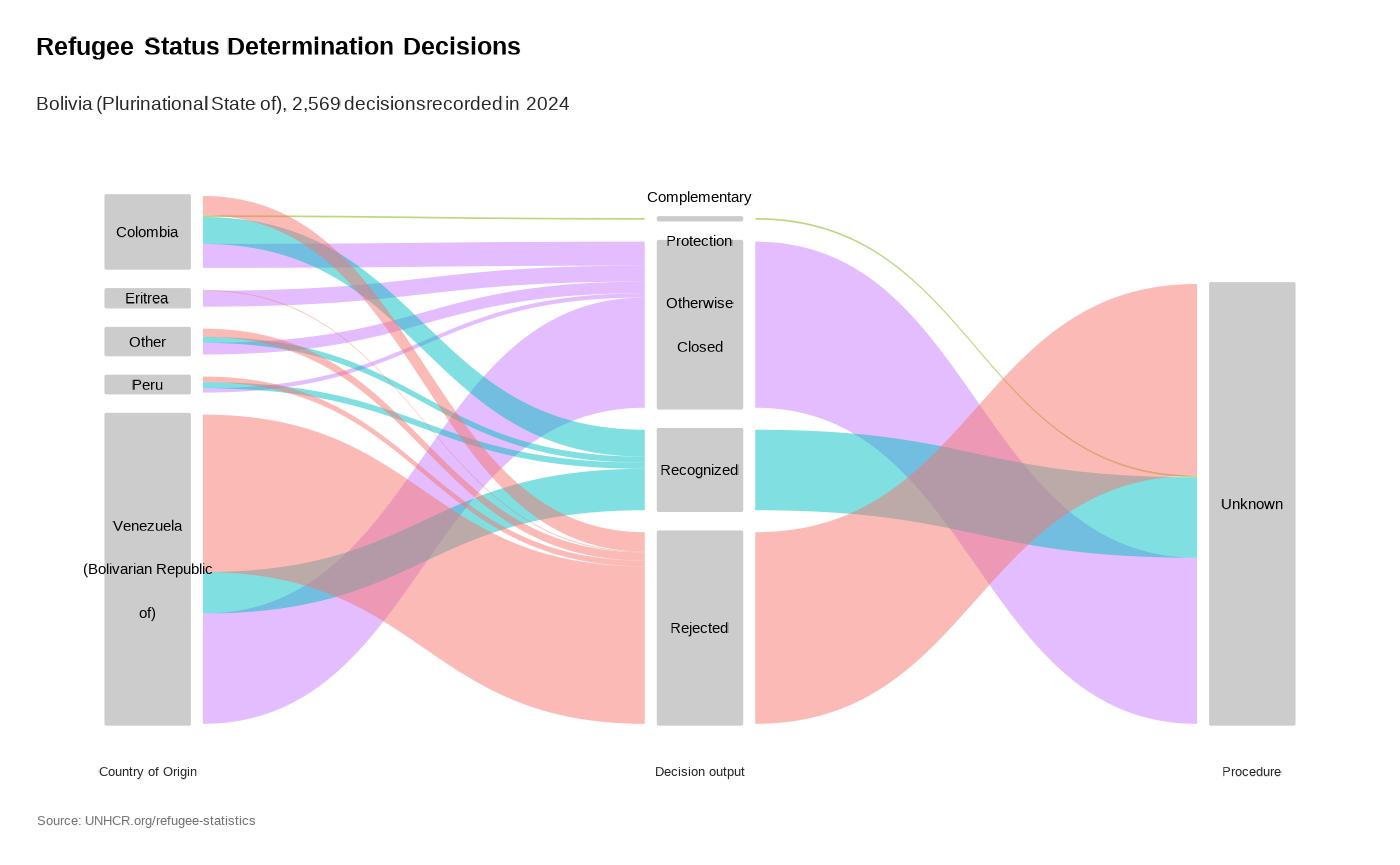
plot_ctr_process(year = 2024, country_asylum_iso3c = "CHL")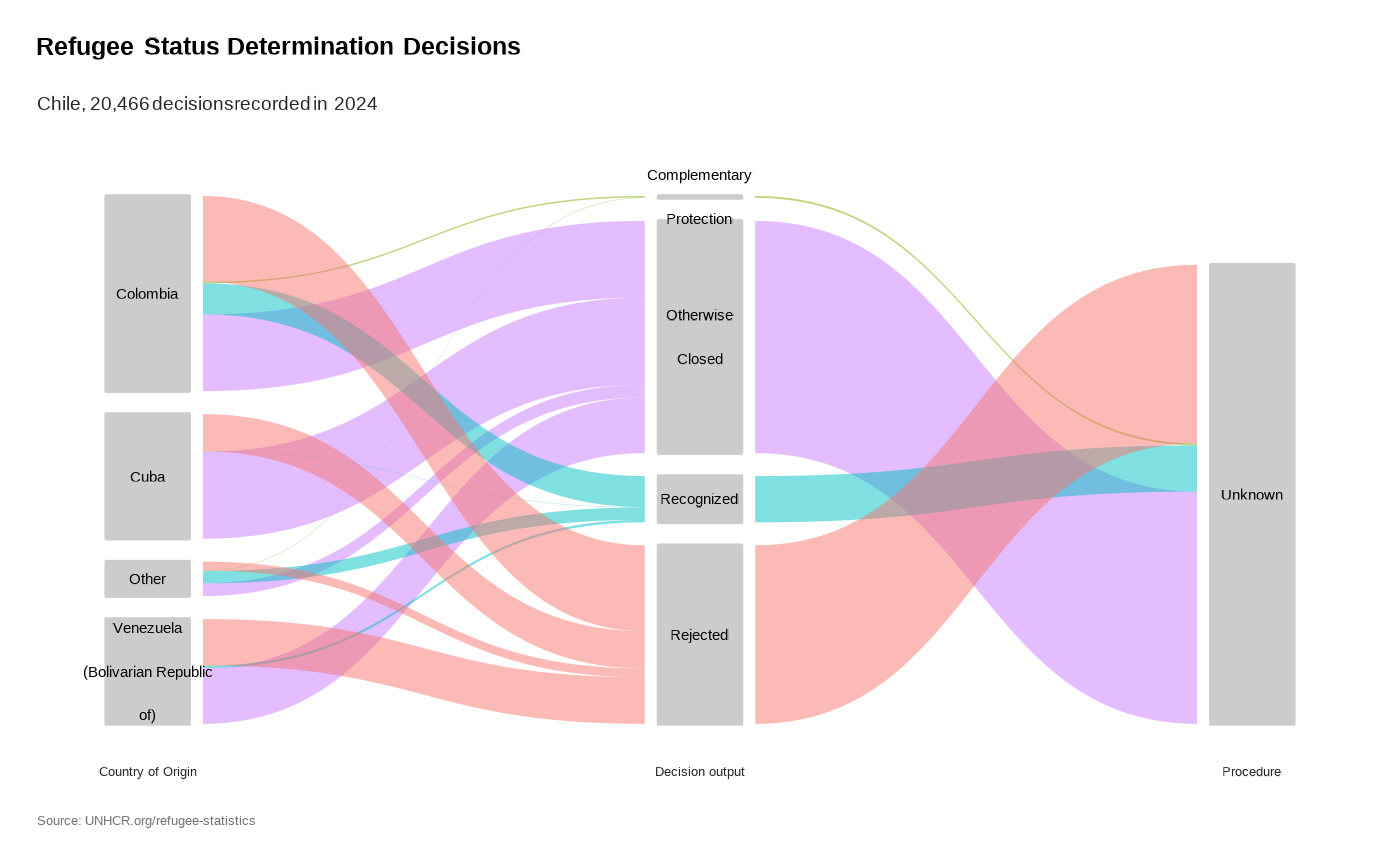
plot_ctr_process(
  year = 2024, country_asylum_iso3c = "USA",
  otherprop = .02
)
plot_ctr_process(
  year = 2024, country_asylum_iso3c = "USA",
  otherprop = .04
)
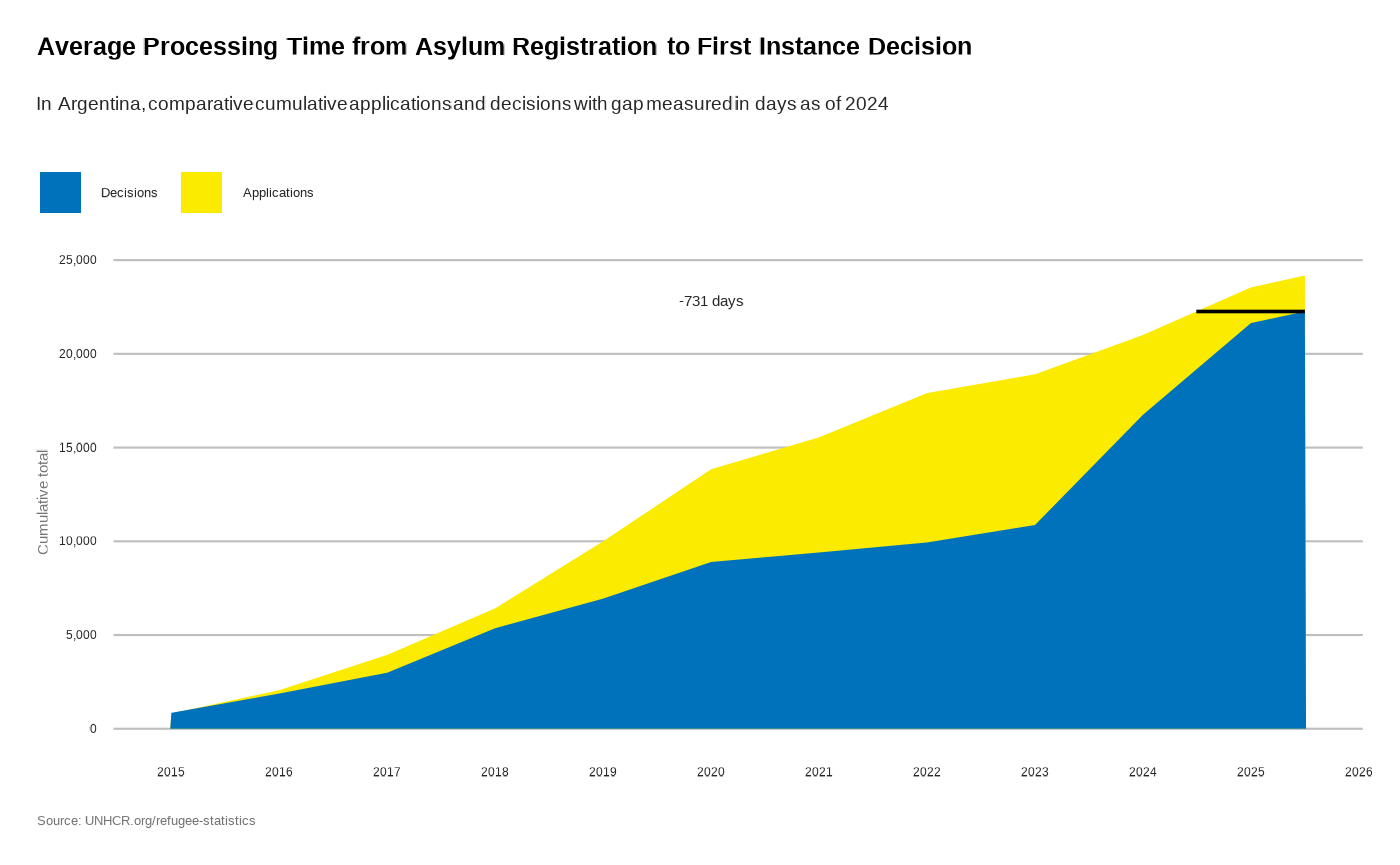
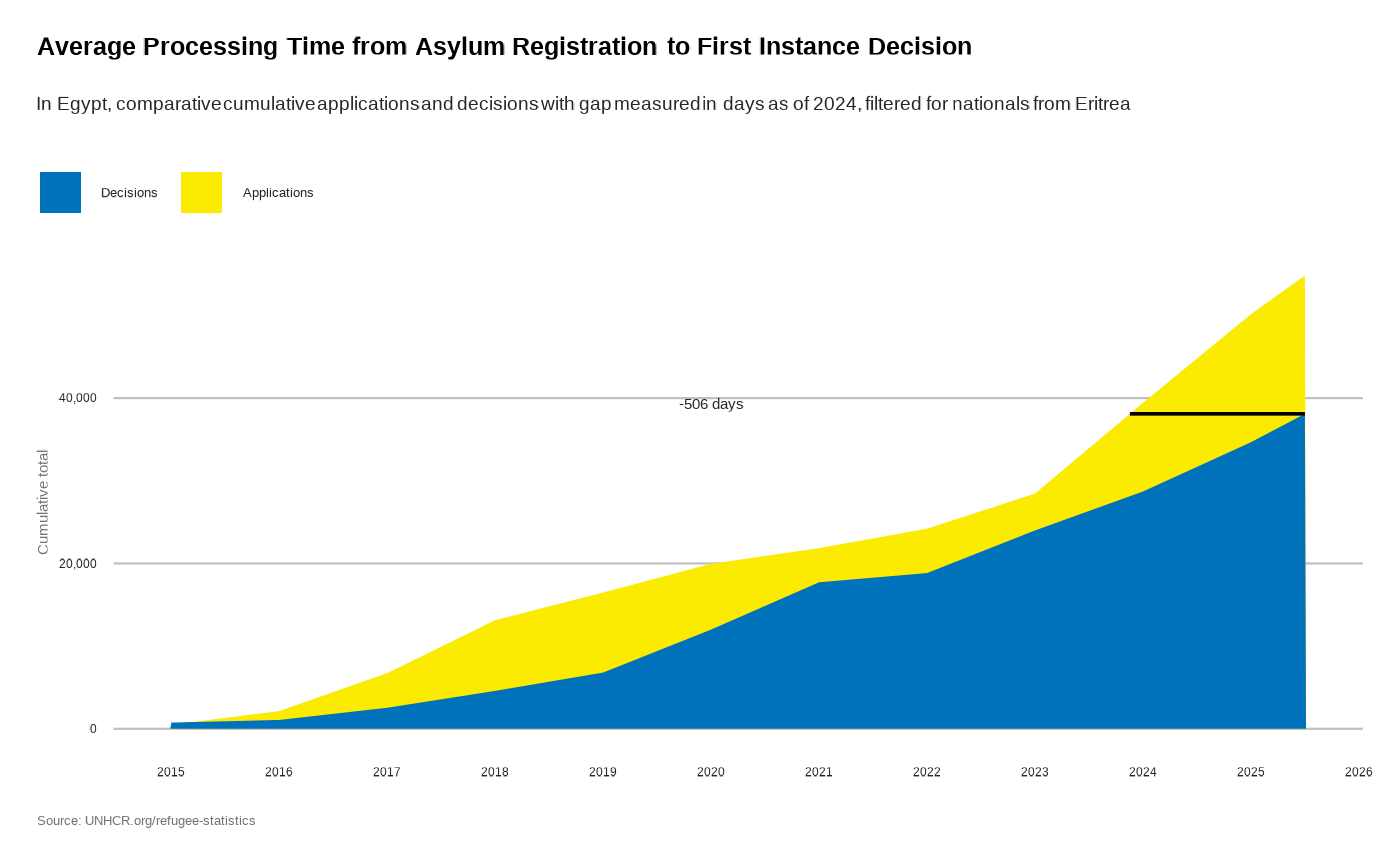
Average Asylum Processing Time
plot_ctr_processing_time(
  year = 2024,
  country_asylum_iso3c = "ARG"
)
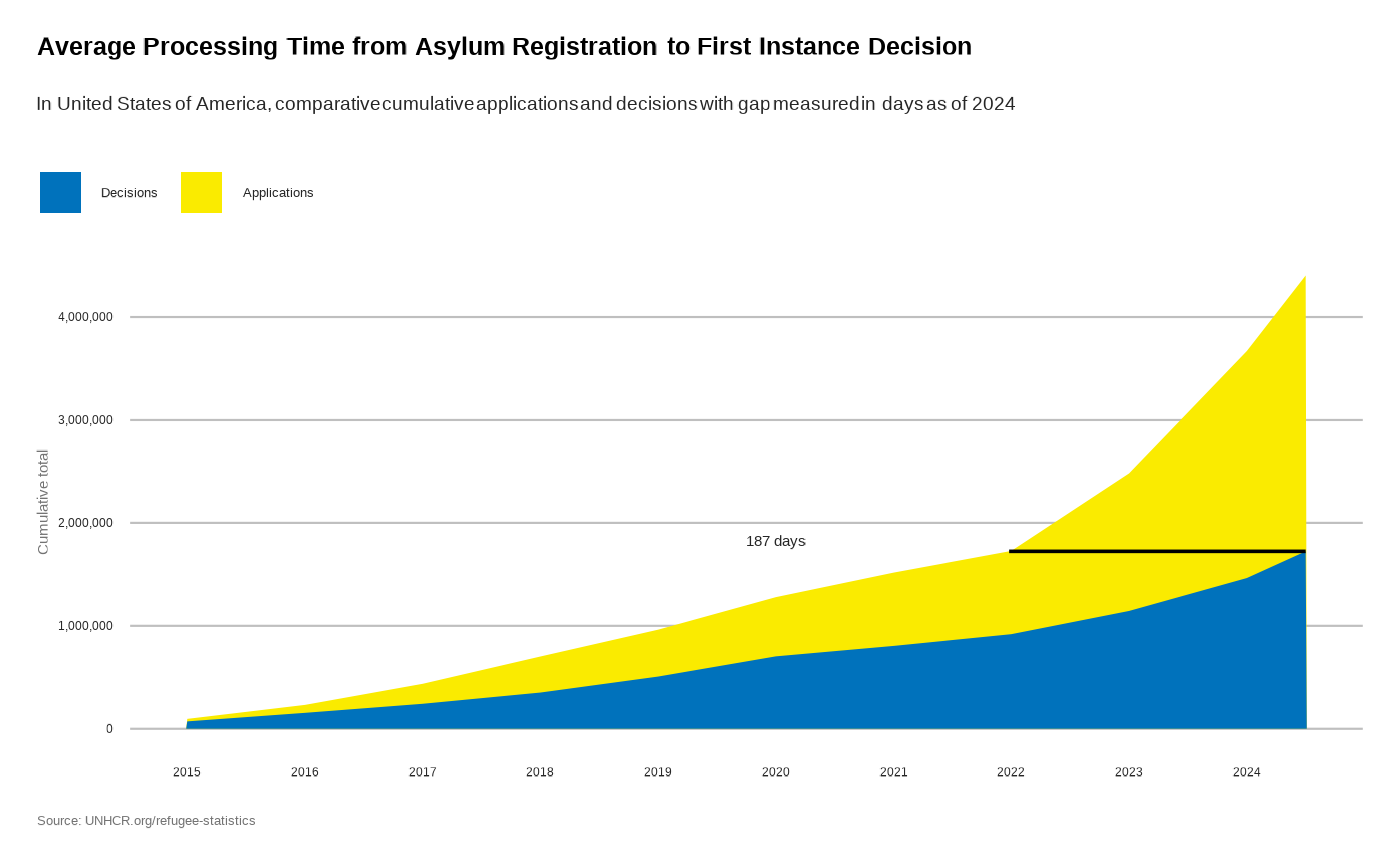
plot_ctr_processing_time(
  year = 2024,
  country_asylum_iso3c = "USA"
)
## Display a filtered version of the chart for a specific country and procedure
plot_ctr_processing_time(
  year = 2024,
  country_asylum_iso3c = "EGY",
  country_origin_iso3c = "ERI",
  procedureType = "U"
)
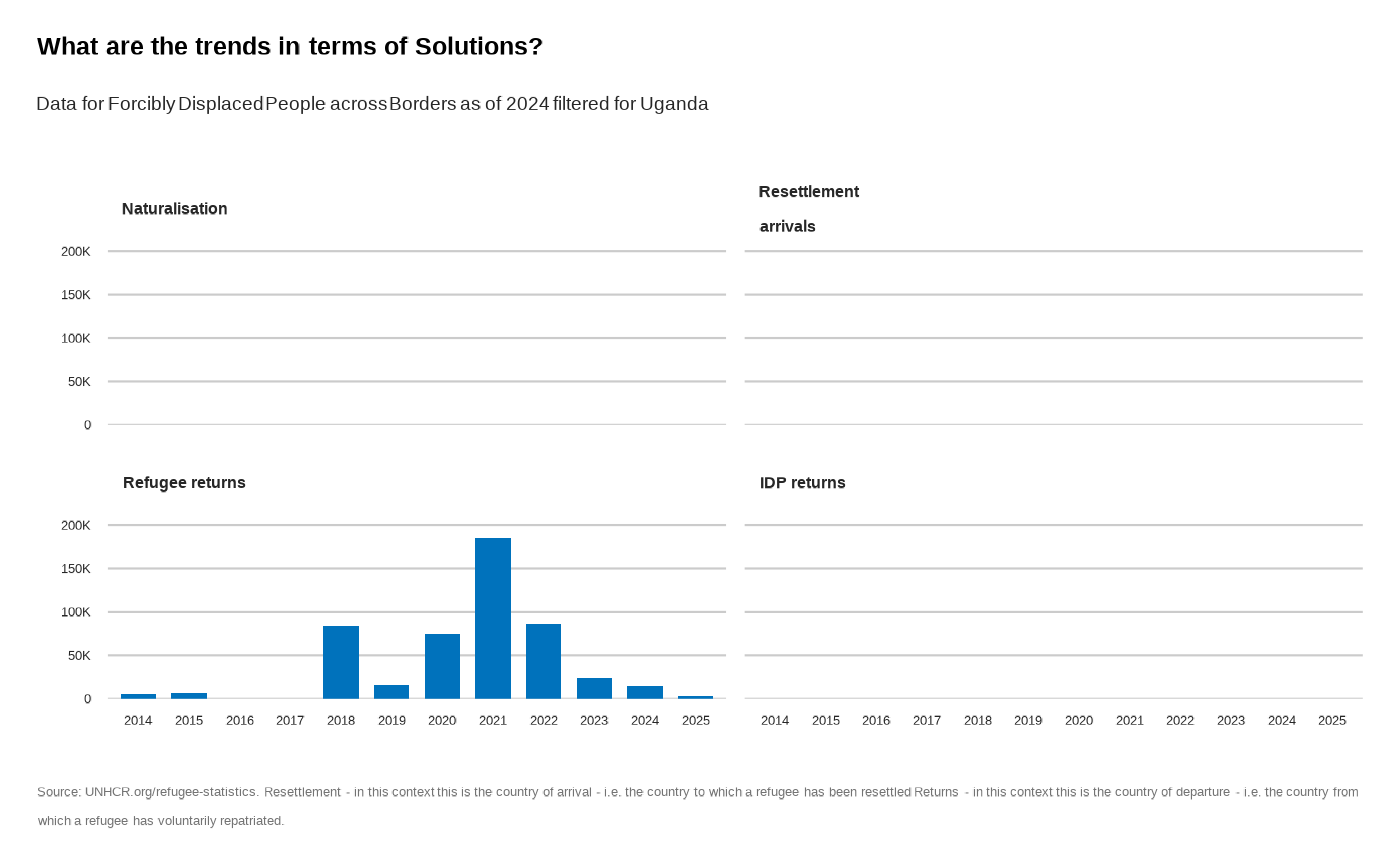
6. Solutions
Plot Solution Over time
plot_ctr_solution(
  year = 2024,
  country_asylum_iso3c = "UGA",
  lag = 10,
  sol_type = c("NAT", "RST", "RET", "RDP")
)
7.Migrant
Plot Ratio Refugee Migrant
plot_ctr_disp_migrant(
  year = 2024,
  country_asylum_iso3c = "MEX",
  top_n_countries = 10
)
# plot_ctr_disp_migrant(year = 2024,
#                     country_asylum_iso3c = "FRA" )