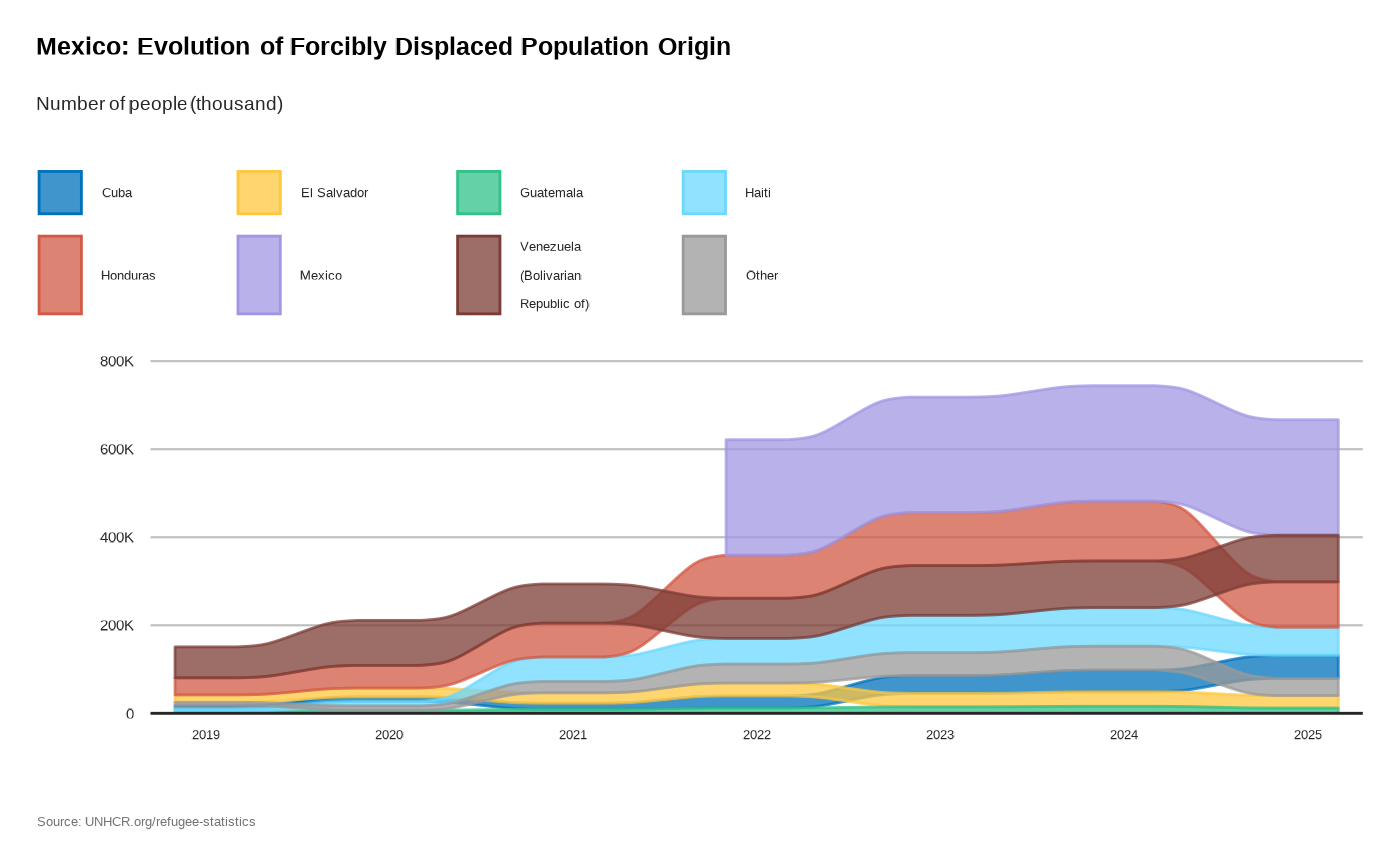
The functions gives a quick overview of the main source of displacement in terms of origin in the country
Usage
plot_ctr_origin_history(
  year = 2024,
  lag = 5,
  country_asylum_iso3c,
  pop_type = c("REF", "ASY", "IDP", "OIP", "STA", "OOC"),
  otherprop = 0.02,
  category_font_size = 10,
  legend_font_size = 10
)
Arguments
- year
Numeric value of the year (for instance 2020)
- lag
Number of year to used as comparison base
- country_asylum_iso3c
Character value with the ISO-3 character code of the Country of Asylum
- pop_type
Vector of character values. Possible population type (e.g.: REF, IDP, ASY, OIP, OIP, OOC, STA)
- otherprop
value set by default to .02 - used to merge origin as "Other"
- category_font_size
Numeric value for axis text font size, default to 10
- legend_font_size
Numeric value for legend font size, default to 10
Examples
plot_ctr_origin_history(
  year = 2024,
  lag = 5,
  country_asylum_iso3c = "MEX",
  pop_type = c(
    "REF",
    "ASY",
    "OIP",
    "IDP"
  ),
  otherprop = .02,
  category_font_size = 10,
  legend_font_size = 10
)

plot_ctr_origin_history(
  year = 2024,
  lag = 5,
  country_asylum_iso3c = "MEX",
  pop_type = c(
    "REF",
    "ASY",
    "OIP",
    "IDP"
  ),
  otherprop = .02
)
plot_ctr_origin_history(
year = 2024,
lag = 5,
country_asylum_iso3c = "MEX",
pop_type = c(
"REF",
"ASY",
"OIP",
"IDP"
),
otherprop = .02
)
