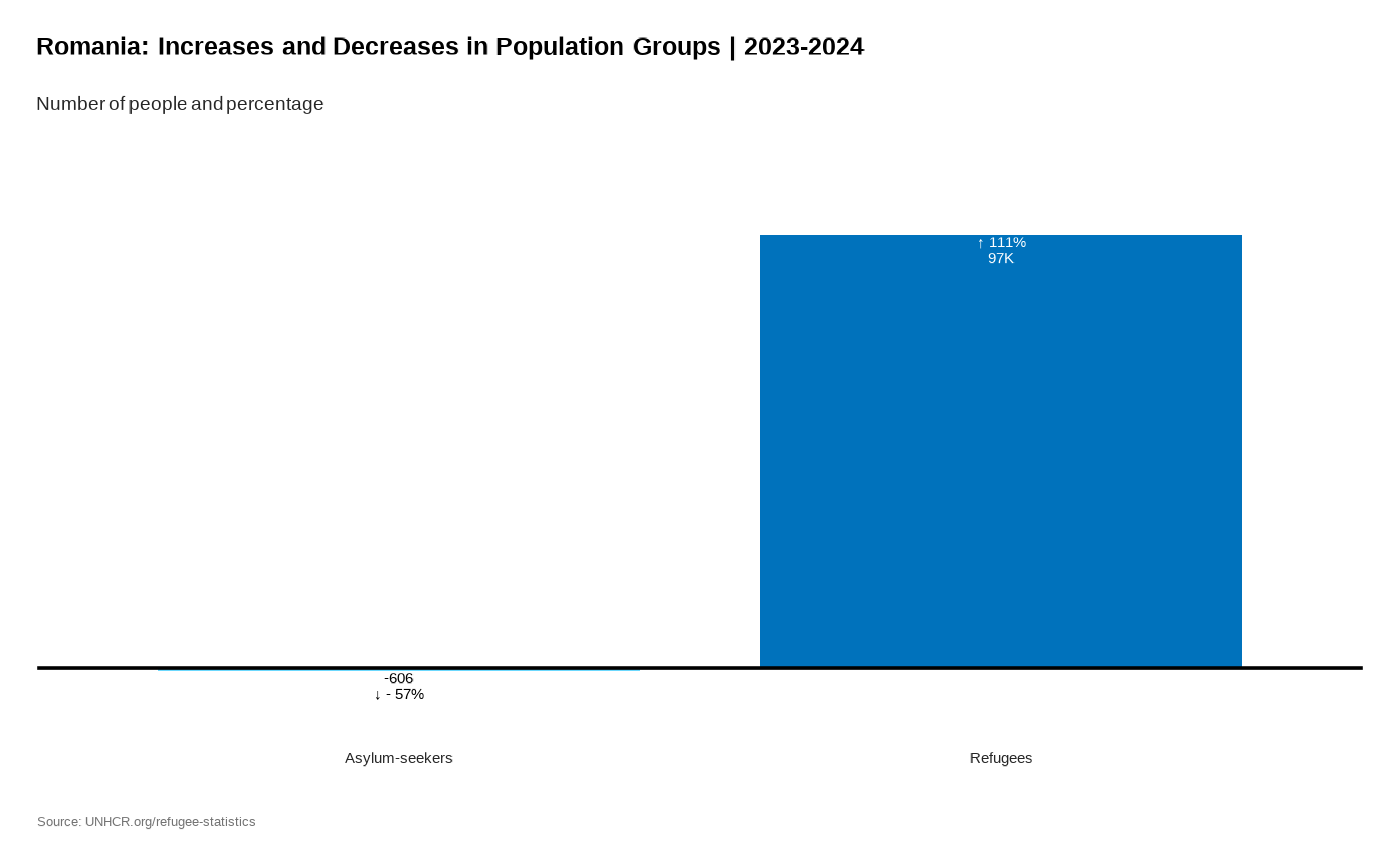
Increases and Decreases in Population Groups
Source:R/plot_ctr_diff_in_pop_groups.R
plot_ctr_diff_in_pop_groups.RdIncreases and Decreases in Population Groups
Usage
plot_ctr_diff_in_pop_groups(
  year = 2024,
  country_asylum_iso3c,
  pop_type = c("REF", "ASY", "IDP", "OIP", "STA", "OOC"),
  label_font_size = 4,
  category_font_size = 10
)
Arguments
- year
Numeric value of the year (for instance 2020)
- country_asylum_iso3c
Character value with the ISO-3 character code of the Country of Asylum
- pop_type
Vector of character values. Possible population type (e.g.: REF, IDP, ASY, OIP, OOC, STA)
- label_font_size
Numeric value for label font size, default to 4
- category_font_size
Numeric value for axis text font size, default to 10