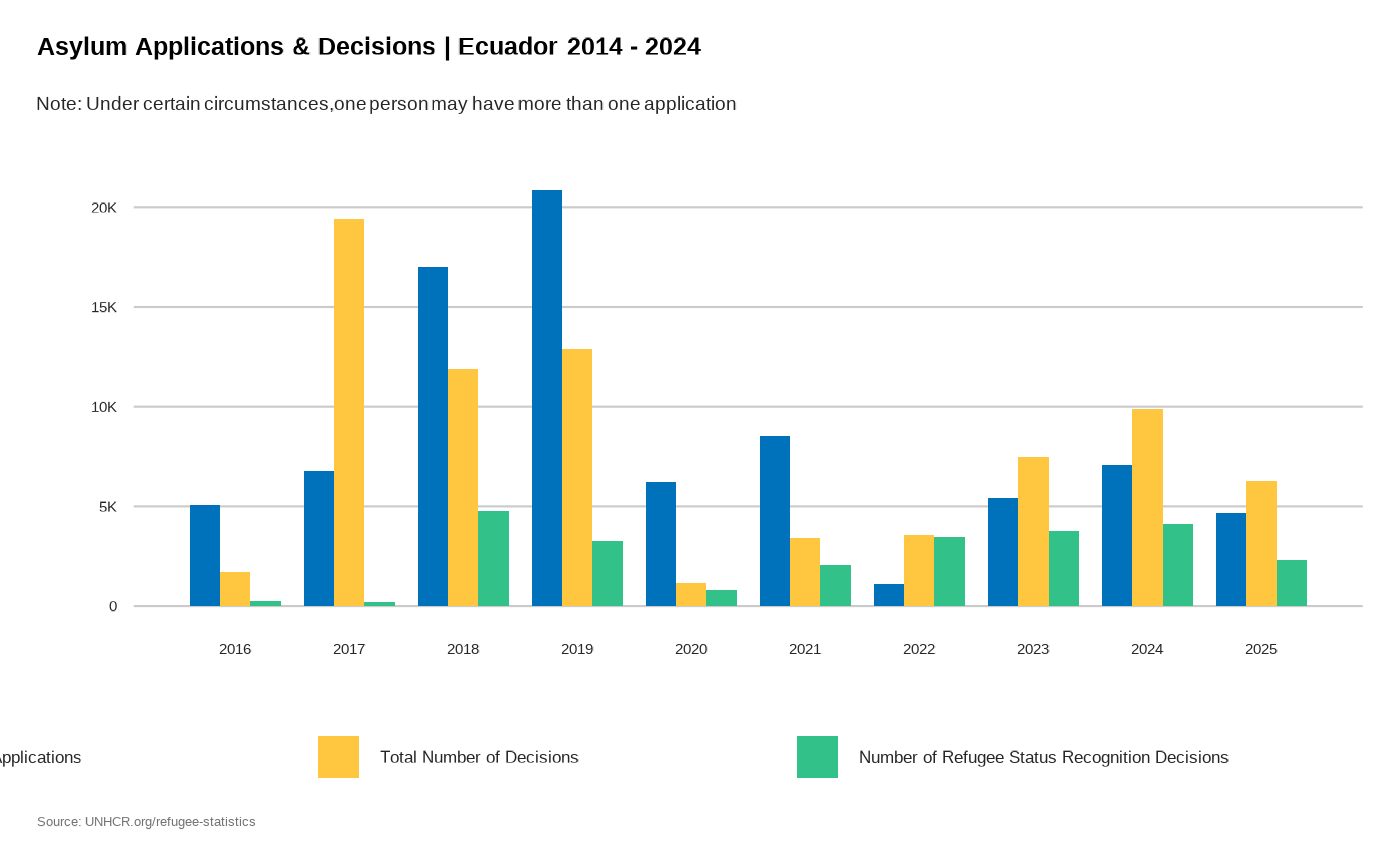
Asylum Applications & Decision over time This charts allow to visualize trends in terms of asylum applications, decision and refugee status recognition
Source:R/plot_ctr_asylum.R
plot_ctr_asylum.RdAsylum Applications & Decision over time This charts allow to visualize trends in terms of asylum applications, decision and refugee status recognition