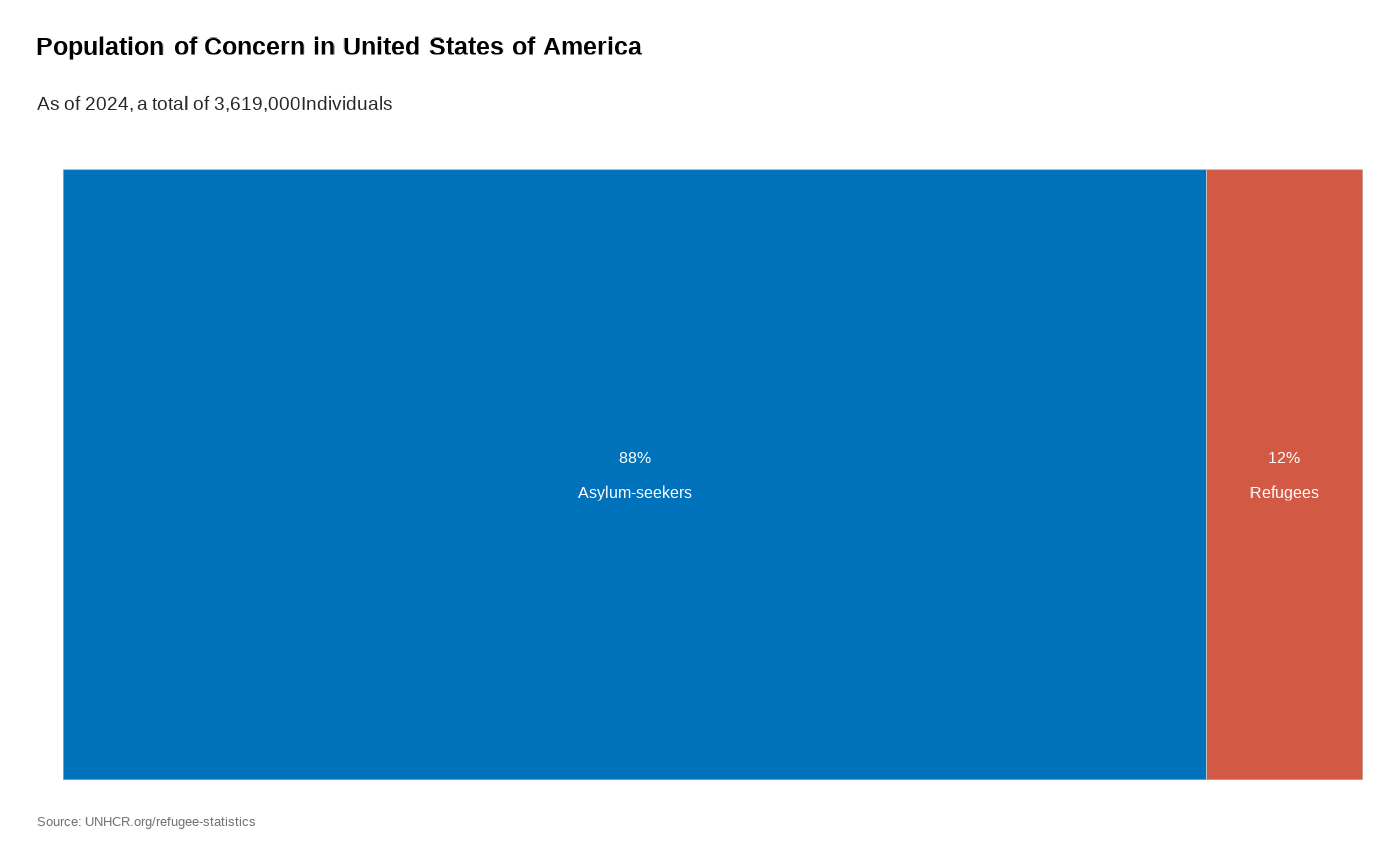
Tree map of Population Groups within a country
Usage
plot_ctr_treemap(
  year = 2024,
  country_asylum_iso3c = country_asylum_iso3c,
  label_font_size = 12
)
Arguments
- year
Numeric value of the year (for instance 2020)
- country_asylum_iso3c
Character value with the ISO-3 character code of the Country of Asylum
- label_font_size
Numeric value for label font size, default to 12
Examples
#
plot_ctr_treemap(
  year = 2024,
  country_asylum_iso3c = "USA",
  label_font_size = 12
)

#
plot_ctr_treemap(
  year = 2024,
  country_asylum_iso3c = "USA"
)
#
plot_ctr_treemap(
year = 2024,
country_asylum_iso3c = "USA"
)