R/plot_reg_rsd.R
plot_reg_rsd.Rd
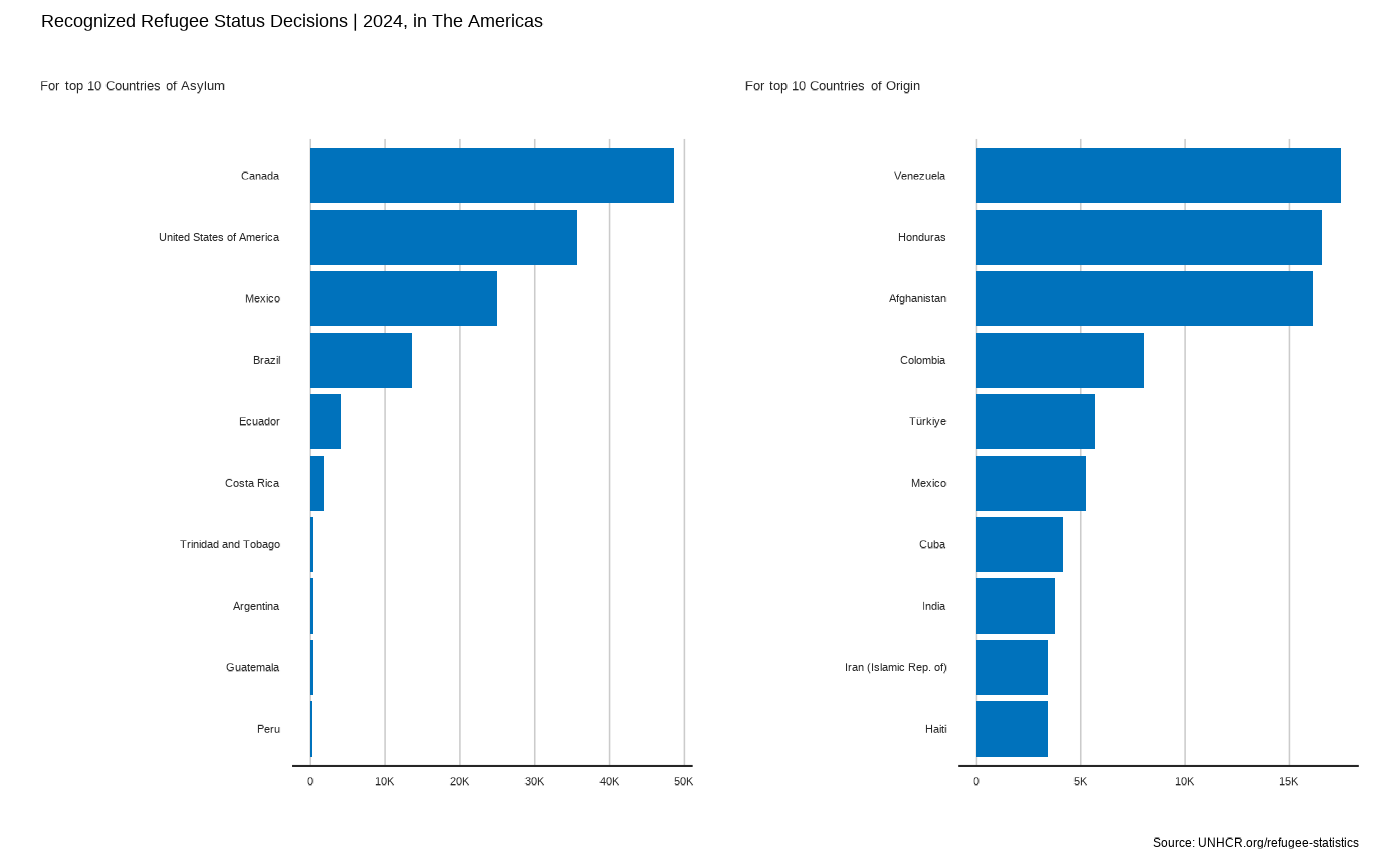
Plot Regional RSD
plot_reg_rsd(
  year = 2024,
  region,
  top_n_countries = 10,
  measure = "Recognized",
  category_font_size = 10
)
Numeric value of the year (for instance 2020)
Character value including the UNHCR region
Numeric value for number of top countries to show
Character value for the measure to display
Numeric value for axis text font size
plot_reg_rsd(
    year = 2024,
    region = "The Americas",
    measure = "Recognized",
    category_font_size = 10
)