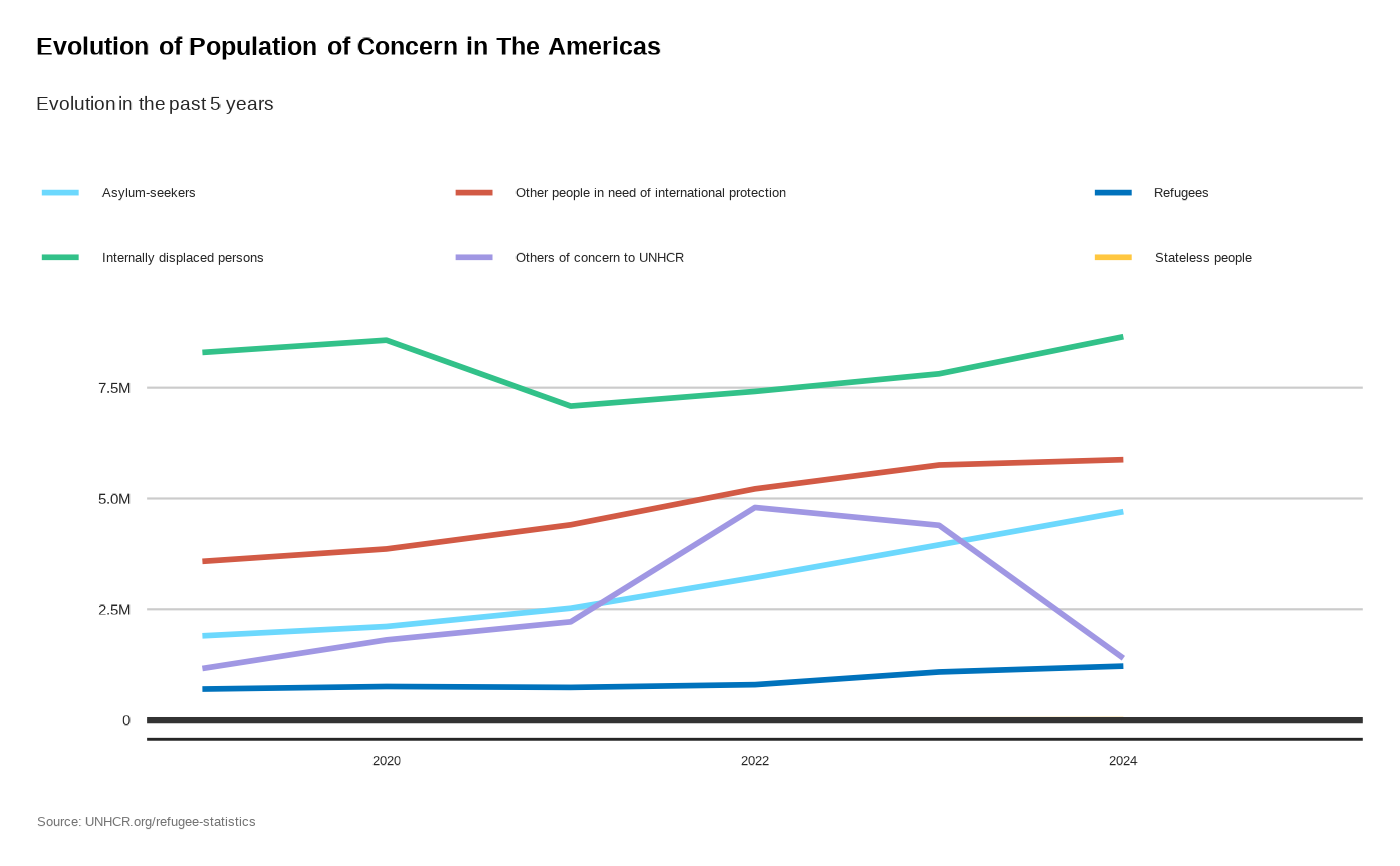
Plot Regional Population Type per Year
Source:R/plot_reg_population_type_per_year.R
plot_reg_population_type_per_year.RdPlot Regional Population Type per Year
Usage
plot_reg_population_type_per_year(
  year = 2024,
  region = "The Americas",
  lag = 5,
  pop_type = c("REF", "ASY", "IDP", "OIP", "STA", "OOC"),
  label_font_size = 4,
  category_font_size = 10,
  legend_font_size = 10
)
Arguments
- year
Numeric value of the year (for instance 2020)
- region
Character value including the UNHCR region
- lag
Number of year to used as comparison base
- pop_type
Vector of character values. Possible population type
- label_font_size
Numeric value for label font size
- category_font_size
Numeric value for axis text font size
- legend_font_size
Numeric value for legend font size
Examples
plot_reg_population_type_per_year(
    year = 2024,
    region = "The Americas",
    label_font_size = 4,
    category_font_size = 10,
    legend_font_size = 10
)
#> Warning: There was 1 warning in `dplyr::mutate()`.
#> ℹ In argument: `unhcr_region = countrycode::countrycode(coa_iso, "iso3c",
#>   "unhcr.region")`.
#> Caused by warning:
#> ! Some values were not matched unambiguously: UNK