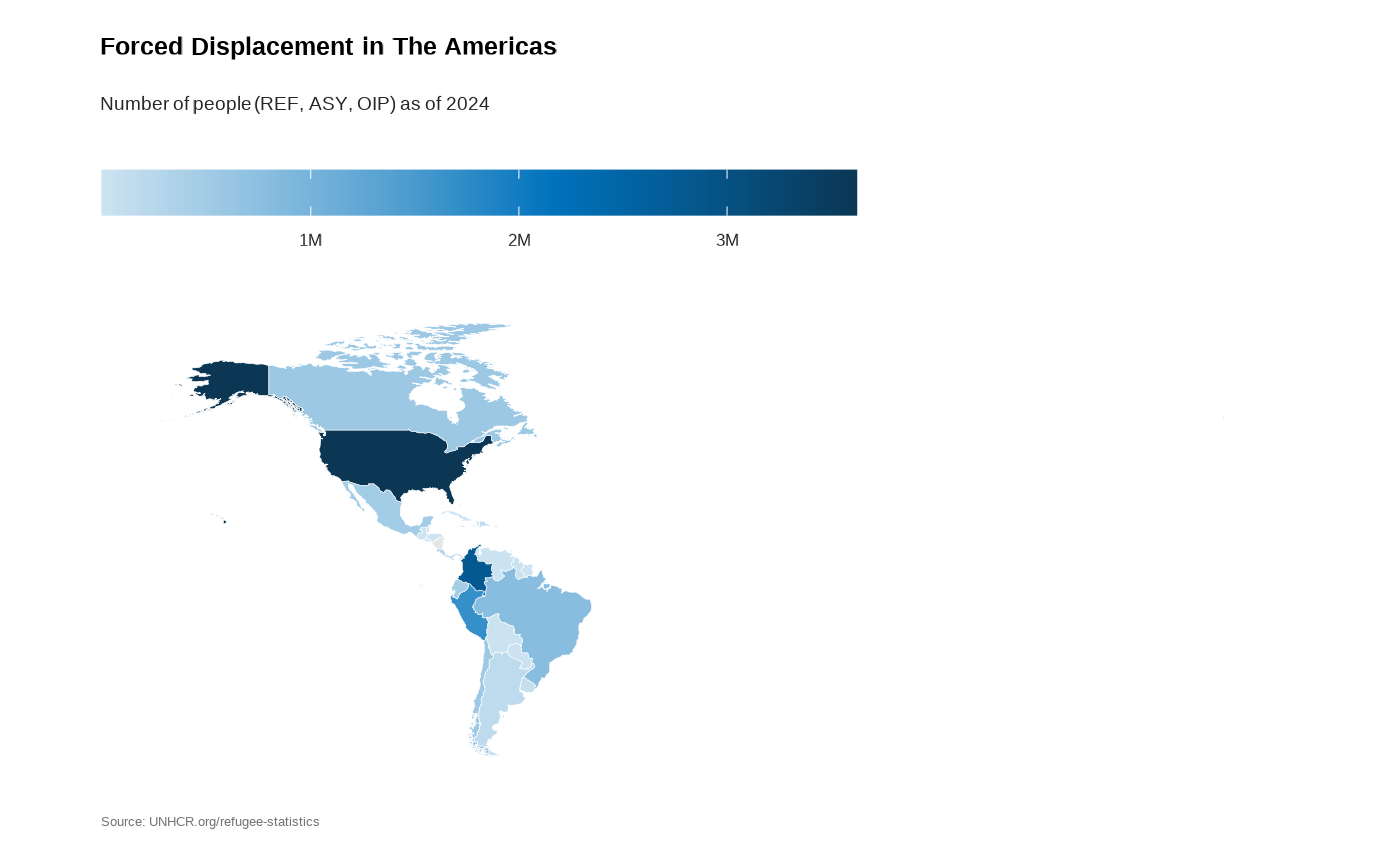
Plot Regional Map
Usage
plot_reg_map(
  year = 2024,
  region = "The Americas",
  topn = 5,
  pop_type = c("REF", "ASY", "OIP"),
  projection = "Mercator",
  maxSymbolsize = 0.25
)
Arguments
- year
Numeric value of the year (for instance 2020)
- region
Character value including the UNHCR region
- topn
Numeric value for number of top items
- pop_type
Vector of character values. Possible population type
- projection
Character value for map projection
- maxSymbolsize
Numeric value for maximum symbol size
Examples
plot_reg_map(
    year = 2024,
    region = "The Americas"
)
#> Warning: There was 1 warning in `dplyr::mutate()`.
#> ℹ In argument: `unhcr_region = countrycode::countrycode(coa_iso, "iso3c",
#>   "unhcr.region")`.
#> Caused by warning:
#> ! Some values were not matched unambiguously: UNK
#> Warning: There was 1 warning in `stopifnot()`.
#> ℹ In argument: `unhcr_region = countrycode::countrycode(iso_a3, "iso3c",
#>   "unhcr.region")`.
#> Caused by warning:
#> ! Some values were not matched unambiguously: -99, ALA, ASM, ATF, BLM, FLK, GGY, HMD, IMN, IOT, JEY, NFK, PCN, SHN, TWN, VIR, WLF