Crunch all variables according to the analysis plan
Arguments
- datalist
An object of the "datalist" class as defined in kobocruncher
- datasource
name of the data source to display, if set to NULL - then pulls the form_title within the settings of the xlsfor
- dico
path to the xlsform file used to collect the data
- n
if not NULL, lumps all levels except for the n most frequent (or least frequent if n < 0) - cf forcats::fct_lump_n()
- n_by
if not NULL, lumps all levels for the cross tabulation variable except for the n_by most frequent (or least frequent if n < 0) - cf forcats::fct_lump_n()
Examples
dico <- kobo_dico( xlsformpath = system.file("sample_xlsform.xlsx", package = "kobocruncher") )
datalist <- kobo_data(datapath = system.file("data.xlsx", package = "kobocruncher") )
kobo_cruncher(datalist = datalist,
dico = dico,
datasource = "a great survey!")
#>
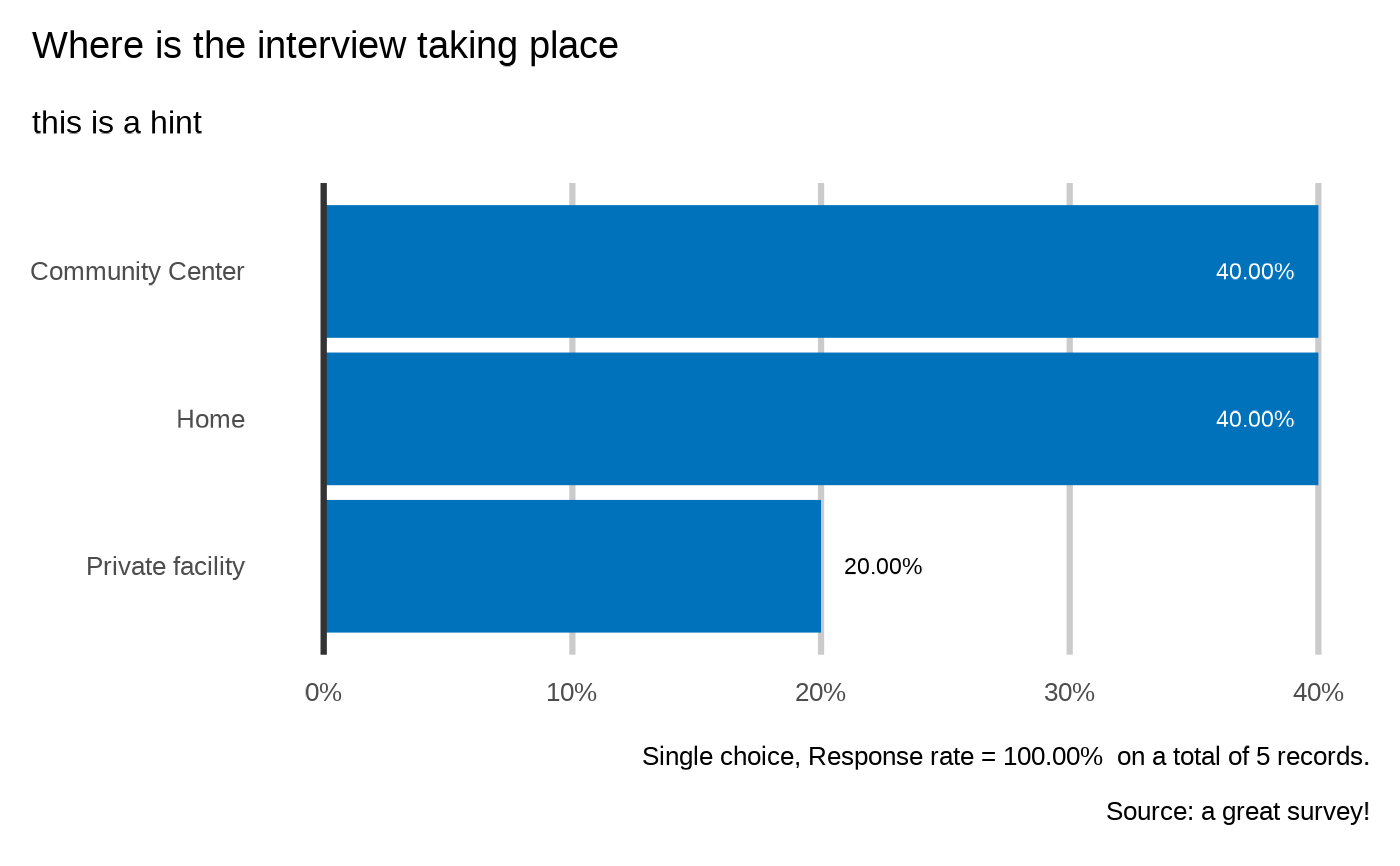
#> Where is the interview taking place
#> `plot_select_one(datalist, dico, "location", datasource = params$datasource, n = 5)`
#>
#>
 #> ------
#>
#>
#>
#> ## Respondant profile
#>
#>
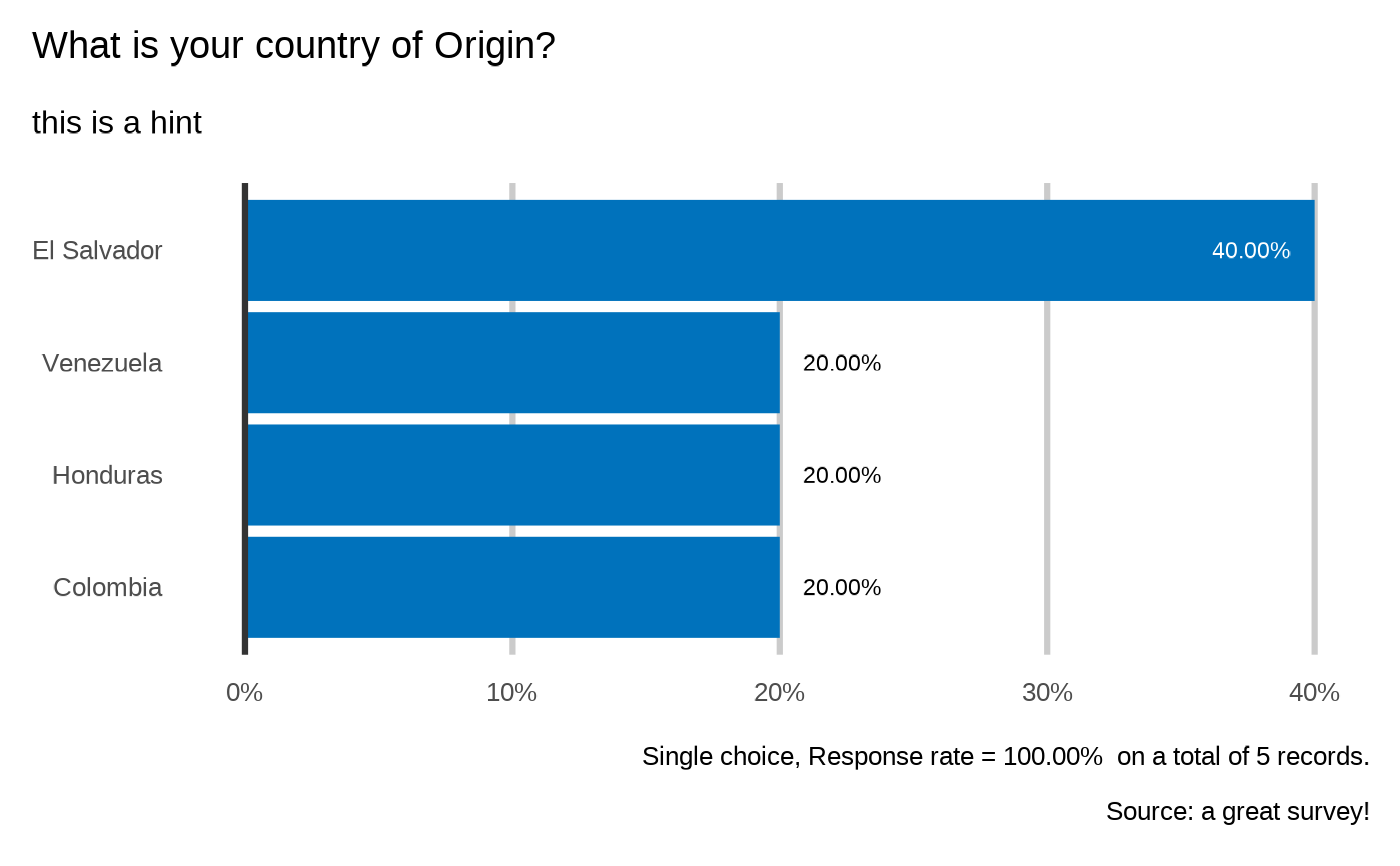
#> What is your country of Origin?
#> `plot_select_one(datalist, dico, "profile.country", datasource = params$datasource, n = 5)`
#>
#>
#> Warning: transformation drops documents
#> Warning: transformation drops documents
#> Warning: transformation drops documents
#> Warning: transformation drops documents
#> Warning: transformation drops documents
#> Warning: transformation drops documents
#> Warning: transformation drops documents
#> Warning: transformation drops documents
#> Warning: transformation drops documents
#> Warning: transformation drops documents
#> ------
#>
#>
#>
#> ## Respondant profile
#>
#>
#> What is your country of Origin?
#> `plot_select_one(datalist, dico, "profile.country", datasource = params$datasource, n = 5)`
#>
#>
#> Warning: transformation drops documents
#> Warning: transformation drops documents
#> Warning: transformation drops documents
#> Warning: transformation drops documents
#> Warning: transformation drops documents
#> Warning: transformation drops documents
#> Warning: transformation drops documents
#> Warning: transformation drops documents
#> Warning: transformation drops documents
#> Warning: transformation drops documents
 #>
#> What's you occupation?
#> `plot_text(datalist, dico, "profile.occupation", datasource=params$datasource)`
#>
#>
#>
#> What's you occupation?
#> `plot_text(datalist, dico, "profile.occupation", datasource=params$datasource)`
#>
#>
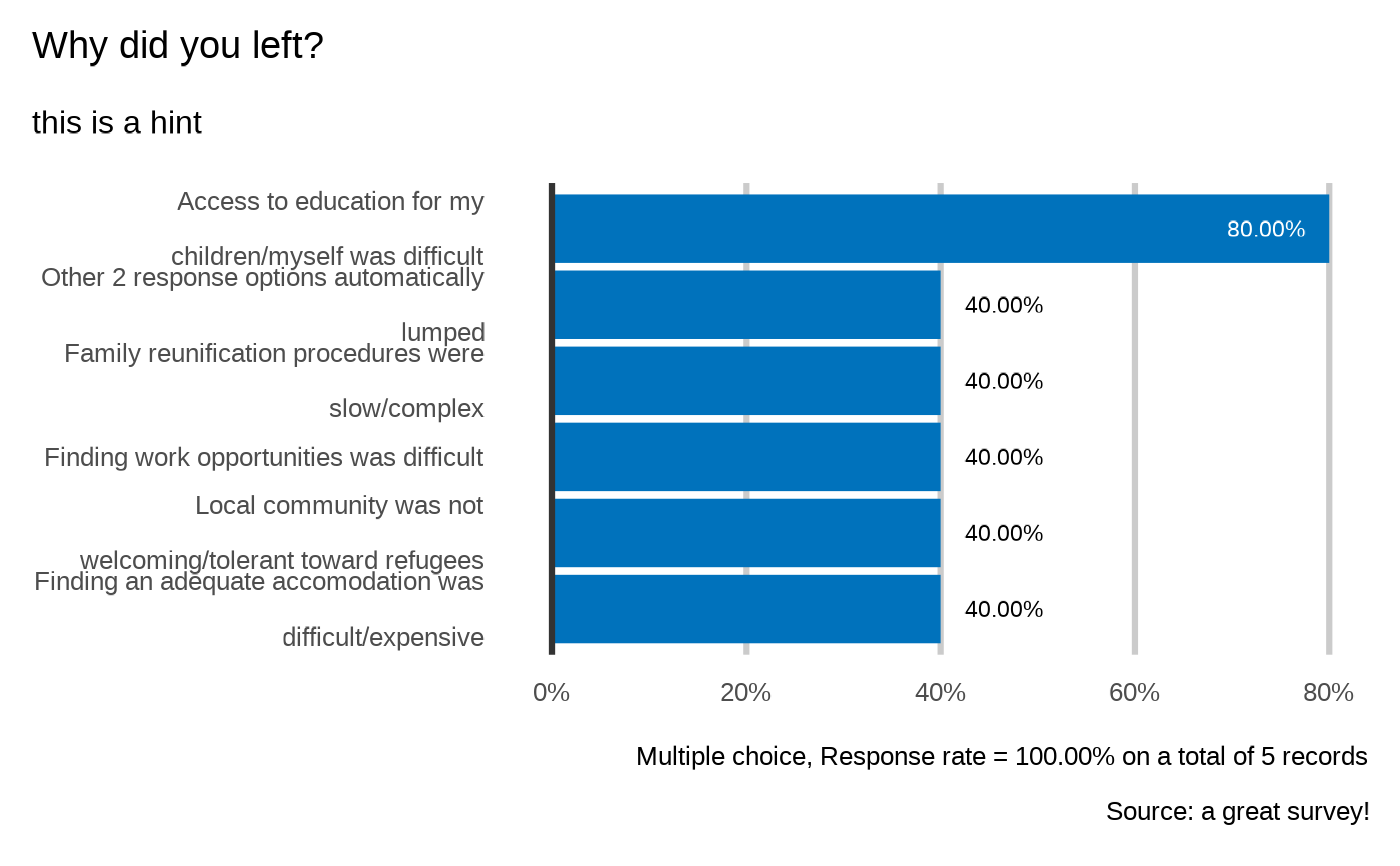
 #> Why did you left?
#> `plot_select_multiple(datalist, dico, "profile.reason", datasource=params$datasource, n=5)`
#>
#>
#> Why did you left?
#> `plot_select_multiple(datalist, dico, "profile.reason", datasource=params$datasource, n=5)`
#>
#>
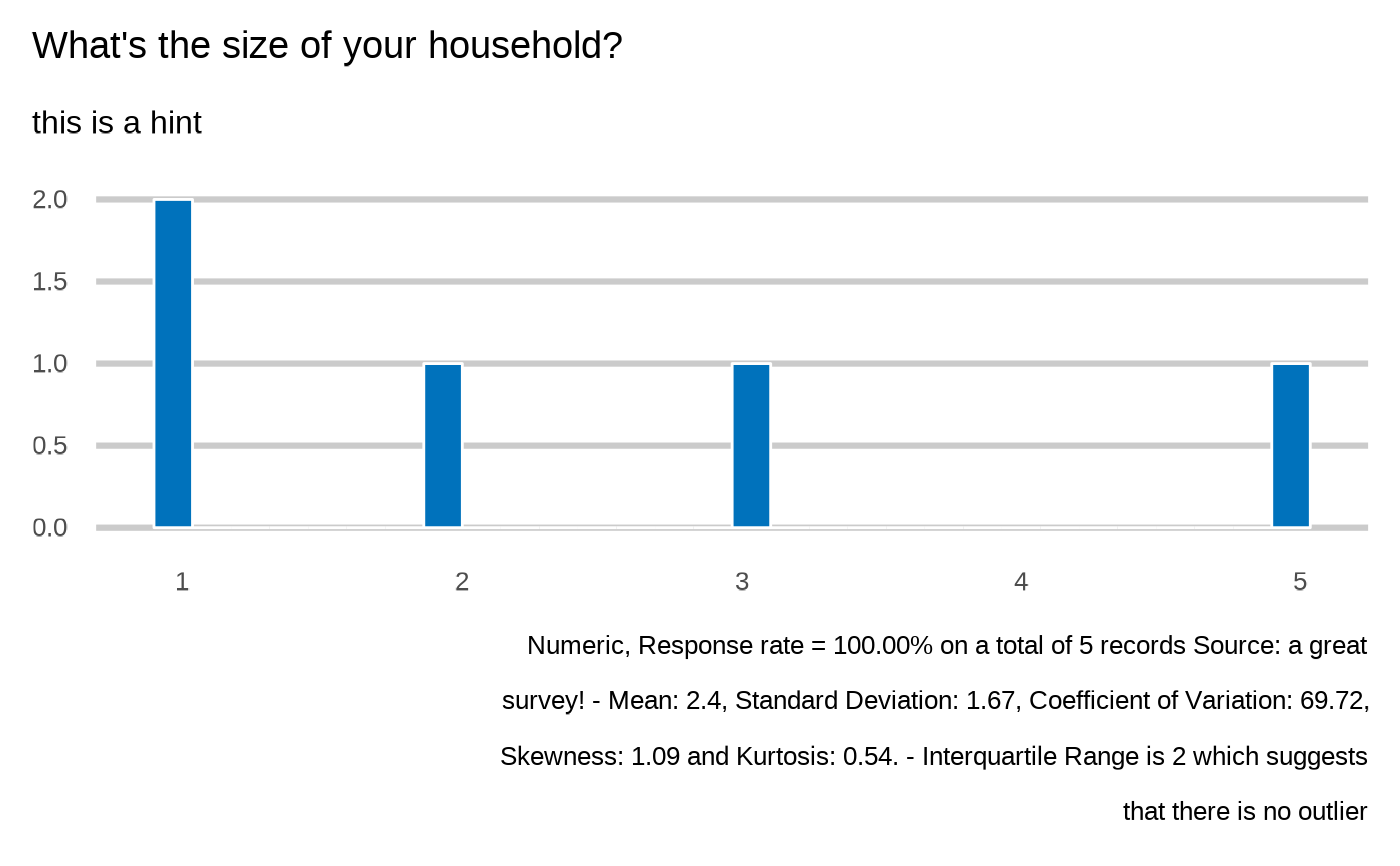
 #> What's the size of your household?
#> `plot_integer(datalist, dico, "profile.HHSize", datasource=params$datasource)`
#>
#>
#> `stat_bin()` using `bins = 30`. Pick better value with `binwidth`.
#> What's the size of your household?
#> `plot_integer(datalist, dico, "profile.HHSize", datasource=params$datasource)`
#>
#>
#> `stat_bin()` using `bins = 30`. Pick better value with `binwidth`.
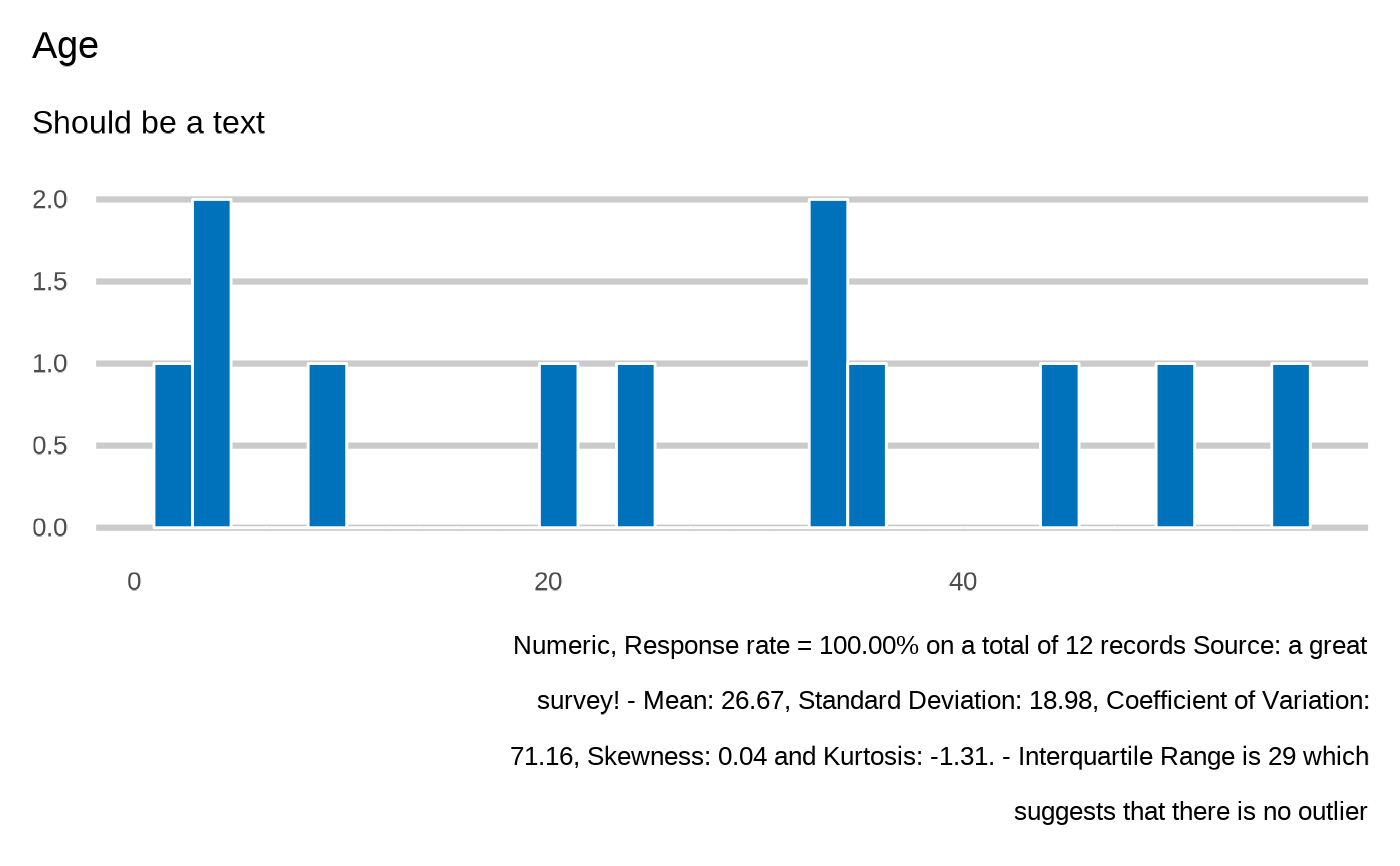
 #> Age
#> `plot_integer(datalist, dico, "members.age", datasource=params$datasource)`
#>
#>
#> `stat_bin()` using `bins = 30`. Pick better value with `binwidth`.
#> Age
#> `plot_integer(datalist, dico, "members.age", datasource=params$datasource)`
#>
#>
#> `stat_bin()` using `bins = 30`. Pick better value with `binwidth`.
 #>
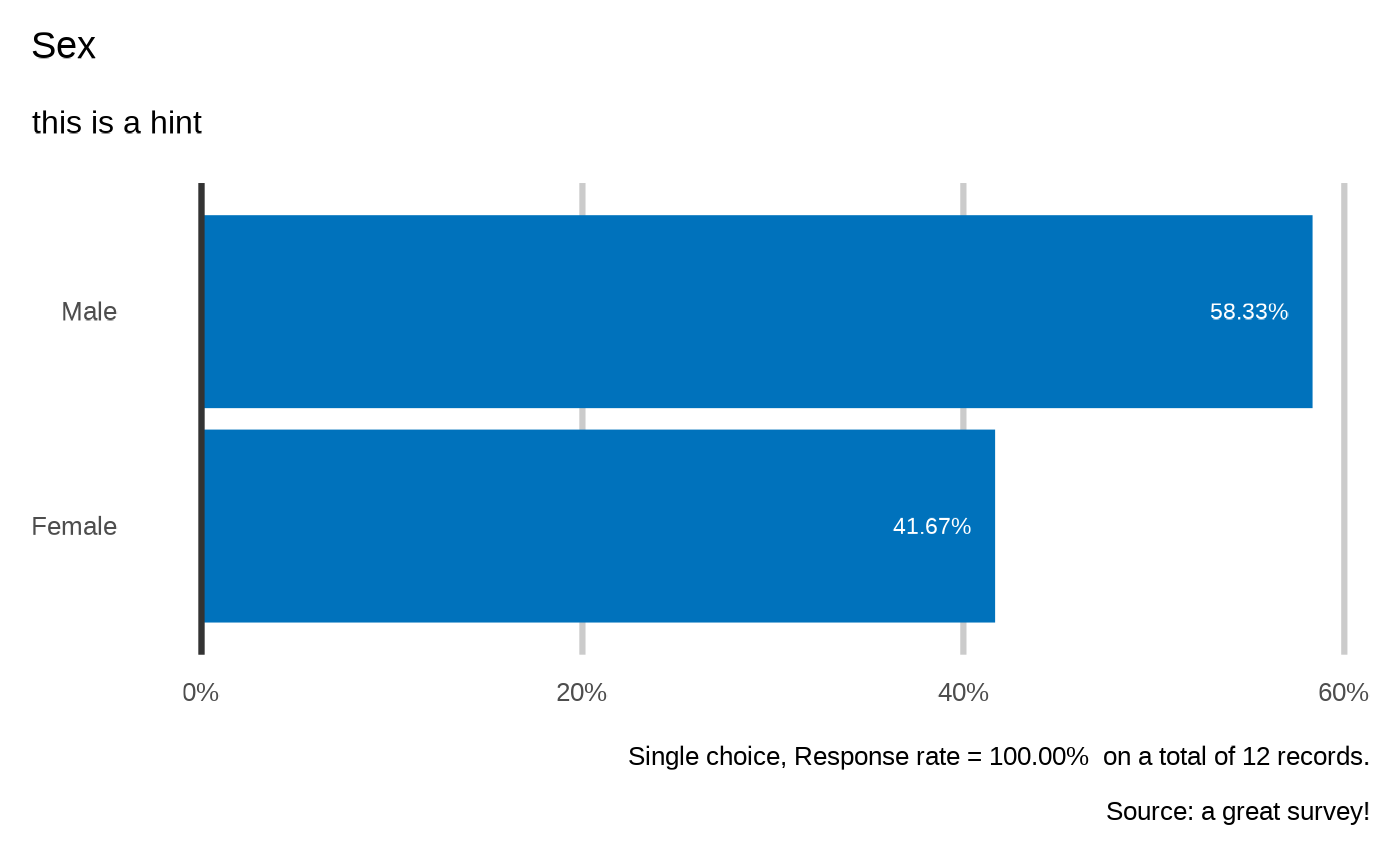
#> Sex
#> `plot_select_one(datalist, dico, "members.sex", datasource = params$datasource, n = 5)`
#>
#>
#>
#> Sex
#> `plot_select_one(datalist, dico, "members.sex", datasource = params$datasource, n = 5)`
#>
#>