Donor Systemic: Concentration Index
Source:R/indicator_donor_systemic_concentration.R
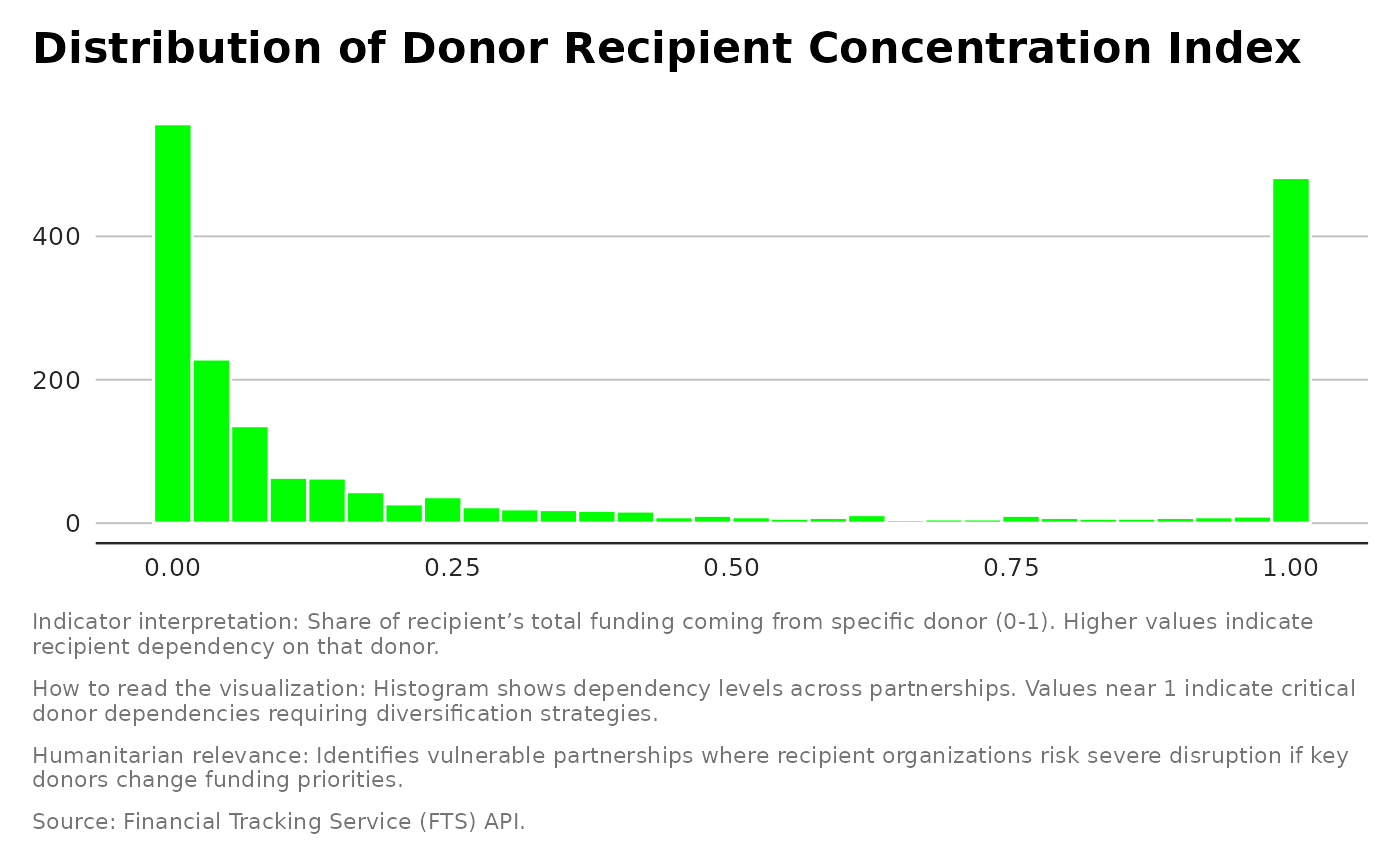
indicator_donor_systemic_concentration.RdCalculates the Herfindahl–Hirschman concentration index (HHI) for each donor, based on the distribution of funding amounts across recipient organizations. A higher value means the donor funds fewer recipients more heavily.
Examples
result <- indicator_donor_recipient_concentration(flows)
print(result$plot)
#> `stat_bin()` using `bins = 30`. Pick better value `binwidth`.
#> Warning: Removed 1 row containing non-finite outside the scale range (`stat_bin()`).