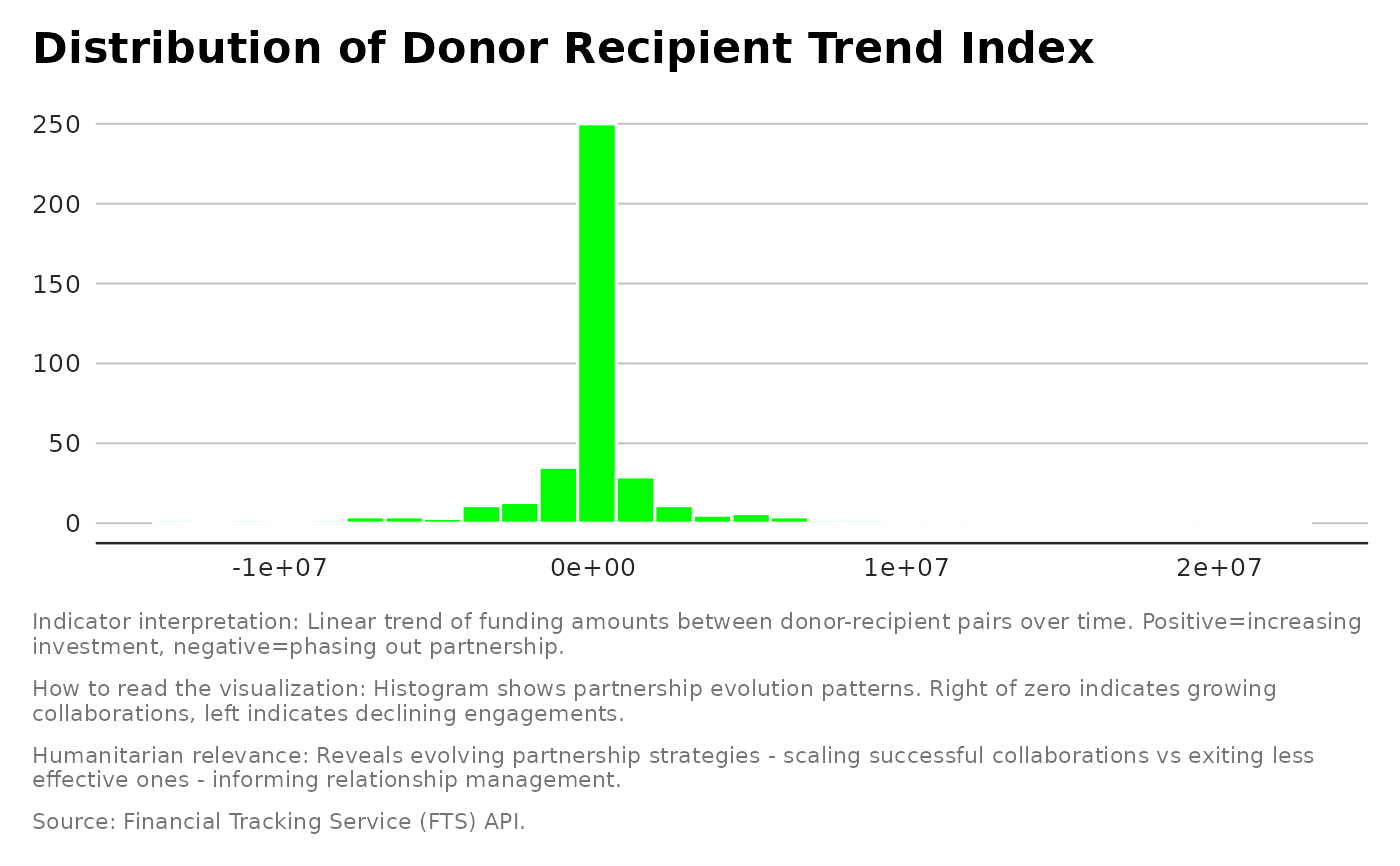
Donor→Recipient: Funding Trend Index
Source:R/indicator_donor_recipient_trend.R
indicator_donor_recipient_trend.RdComputes the slope of the funding trend over time for each donor–recipient pair.
Usage
indicator_donor_recipient_trend(
  flows,
  donor_recipient_pairs = NULL,
  donors = NULL,
  recipient_name = NULL
)
Arguments
- flows
A dataframe with
sourceObjects,destinationObjects,budgetYear, andamountUSD.- donor_recipient_pairs
(optional) A dataframe of donor–recipient pairs to merge results with.
- donors
(optional used if recipient_name is provided ) A dataframe with donor names to merge with the results.
- recipient_name
(optional) the name of a specific recipient to filter the results of the function
Value
A list with a tibble with donor, recipient,
and DonorRecipient_Trend_Index (slope) and a plot.
Details
Goal: Detects whether funding between a donor and recipient is increasing or decreasing over time (slope of linear regression).
Examples
result <- indicator_donor_recipient_trend(flows)
print(result$plot)
#> `stat_bin()` using `bins = 30`. Pick better value `binwidth`.
#> Warning: Removed 1480 rows containing non-finite outside the scale range (`stat_bin()`).