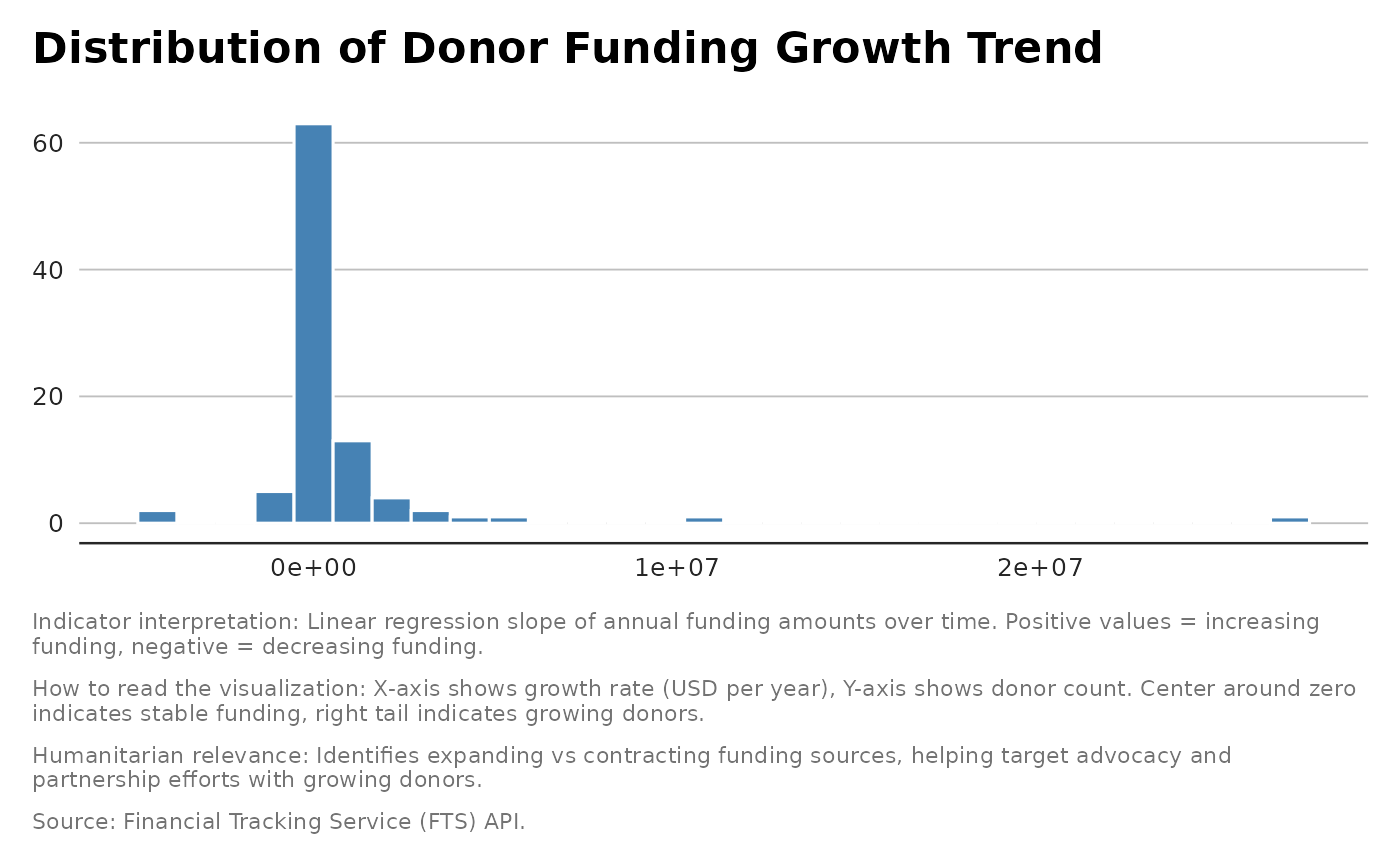
Calculates the linear trend (slope) of annual funding amounts over years for each donor.
Value
A list with a tibble with donor and Funding_Growth_Trend (slope of funding
over years) and a plot.
Examples
result <- indicator_donor_funding_growth(flows, donor_name = "Germany")
print(result$plot)
#> `stat_bin()` using `bins = 30`. Pick better value `binwidth`.
#> Warning: Removed 154 rows containing non-finite outside the scale range (`stat_bin()`).