Donor→Destination: Coverage Index
Source:R/indicator_donor_destination_coverage.R
indicator_donor_destination_coverage.RdCalculates the proportion of destinations a donor supports out of the total destinations in the dataset.
Details
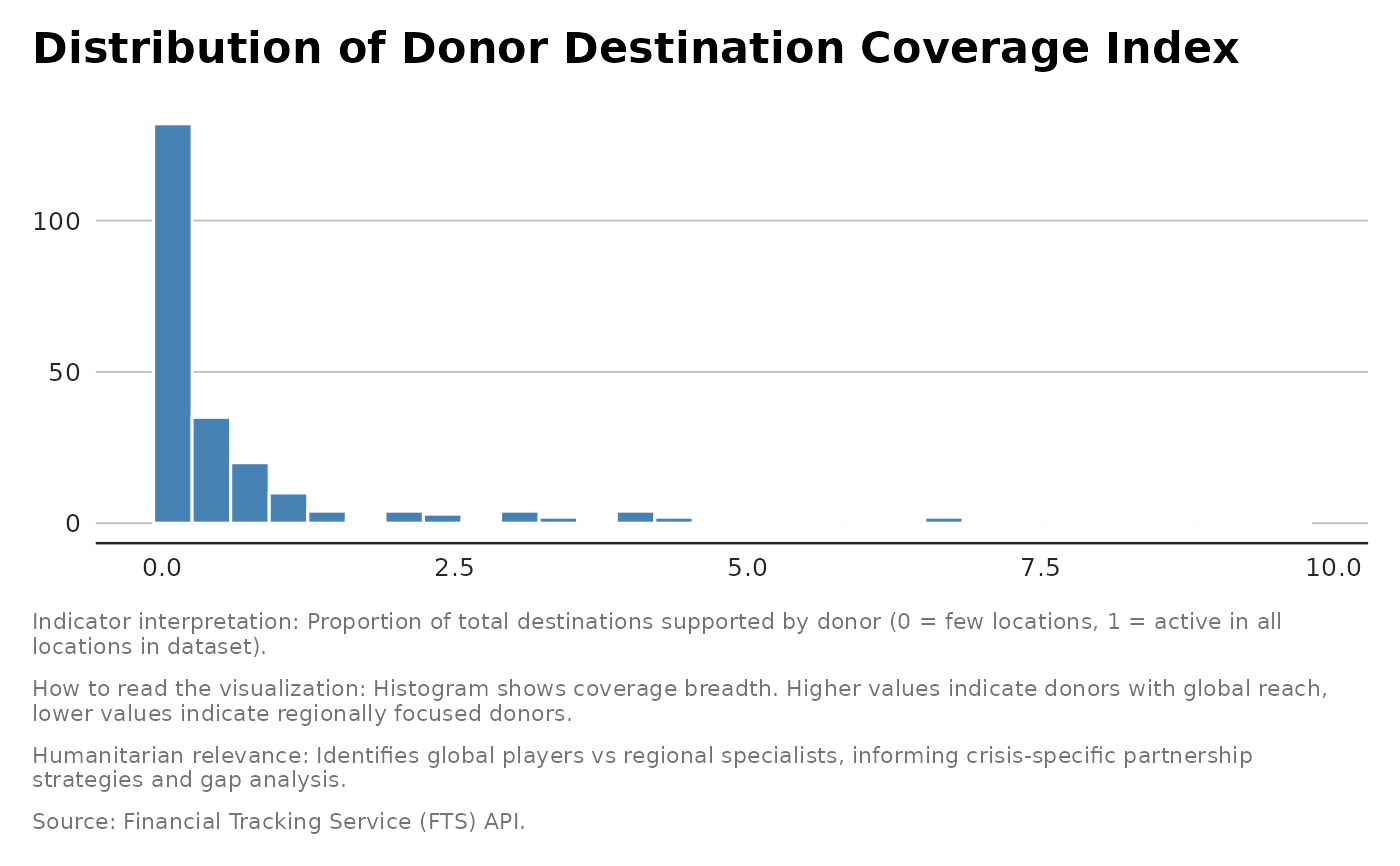
Goal: Measures how many distinct destinations (countries/plans/sectors) a donor supports compared to the total destinations in the dataset.
Examples
result <- indicator_donor_destination_coverage(flows)
print(result$plot)
#> `stat_bin()` using `bins = 30`. Pick better value `binwidth`.