Destination-Focused: Funding Volatility Index
Source:R/indicator_destination_funding_volatility.R
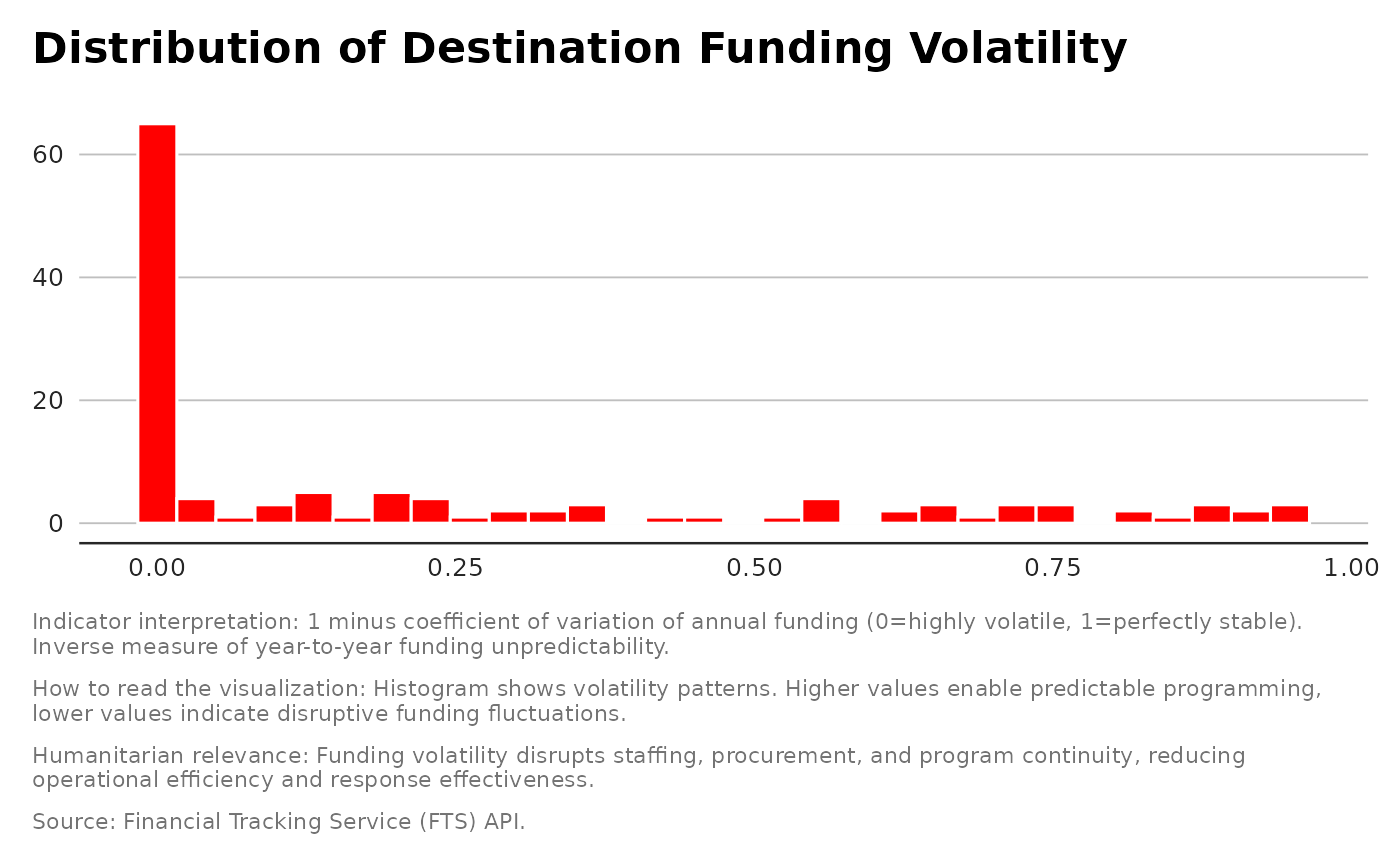
indicator_destination_funding_volatility.RdCalculates volatility in funding for each destination across budgetYear,
using the coefficient of variation (CV) of annual totals.
Value
A list with a tibble with destination and Destination_Funding_Volatility
(0–1, where 1 = stable) and a plot.
Examples
result <-indicator_destination_funding_volatility(flows)
print(result$plot)
#> `stat_bin()` using `bins = 30`. Pick better value `binwidth`.
#> Warning: Removed 44 rows containing non-finite outside the scale range (`stat_bin()`).