Destination-Focused: Funding Diversity Index
Source:R/indicator_destination_funding_diversity.R
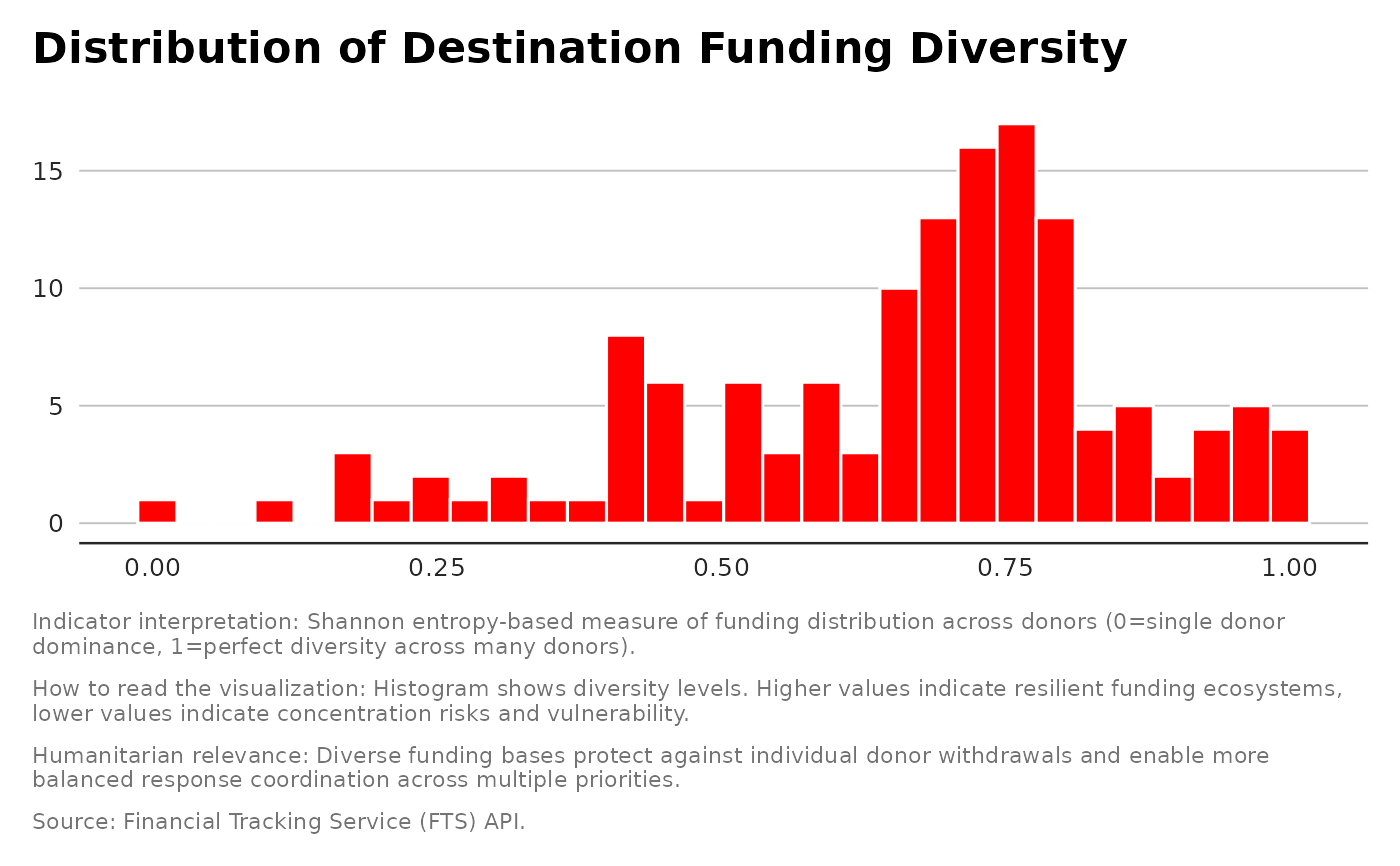
indicator_destination_funding_diversity.RdMeasures how diversified each destination's funding base is across donors
using Shannon entropy of amountUSD distribution.
Value
A list with a tibble with destination and Destination_Funding_Diversity (0–1 scale) and a plot.
Details
Goal: Measures how many donors contribute to each destination — higher = more diverse and resilient funding base.
Examples
result <- indicator_destination_funding_diversity(flows)
print(result$plot)
#> `stat_bin()` using `bins = 30`. Pick better value `binwidth`.
#> Warning: Removed 31 rows containing non-finite outside the scale range (`stat_bin()`).