Compute Portfolio Scores for a Recipient
Source:R/analysis_portfolio_scores.R
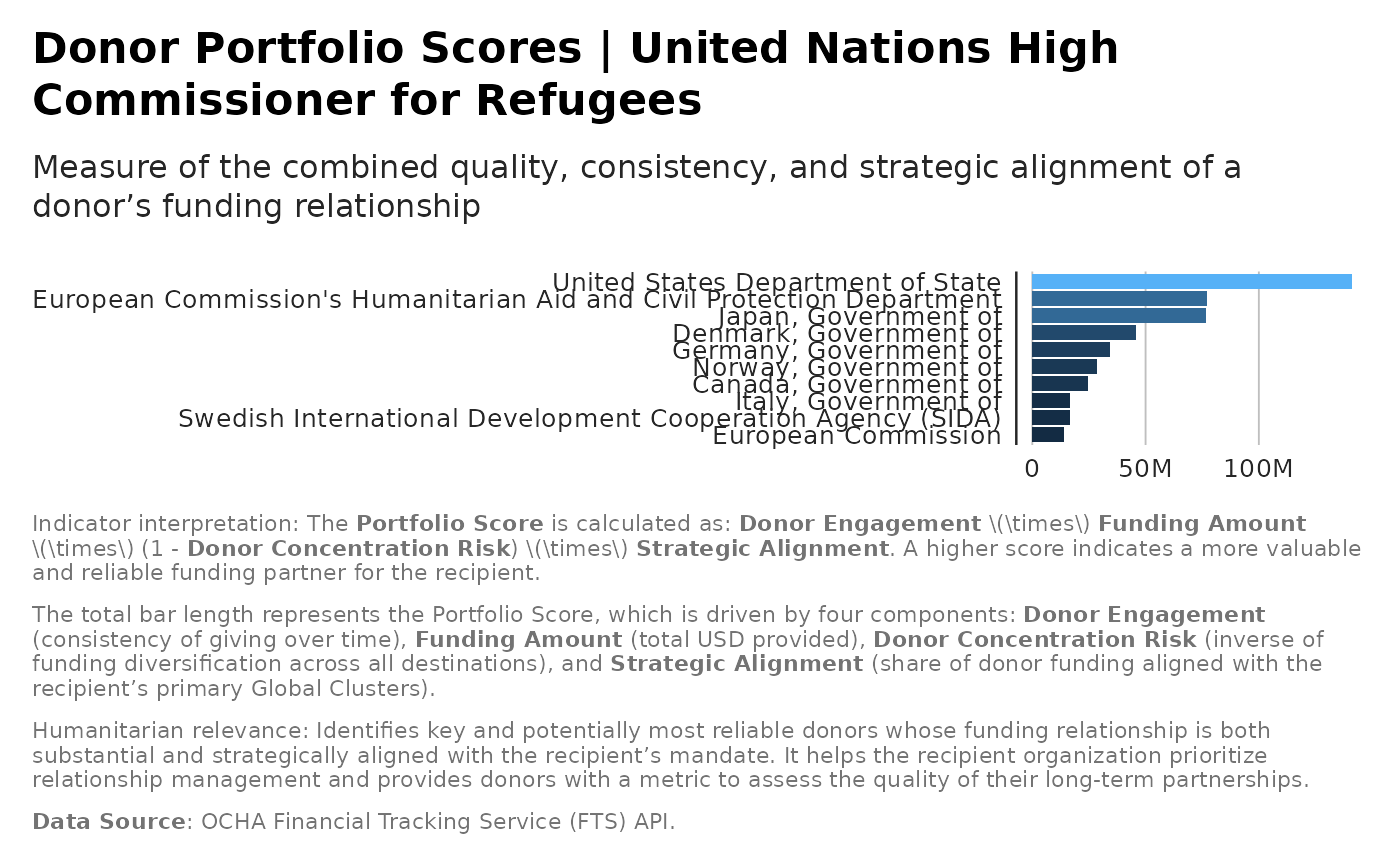
analysis_portfolio_scores.RdComputes a portfolio score for each donor relative to a given recipient using the formula:
Value
a list with data, aka Tibble with columns: donor, donor_engagement, funding_amount, donor_concentration_risk, strategic_alignment, Portfolio_Score and plot
Details
Portfolio_Score = SUM( Donor_engagement * Funding_amount * (1 - Donor_concentration_risk) * Strategic_alignment )
Where:
Donor_engagement = fraction of years the donor funded the recipient (0-1)
Funding_amount = sum(amountUSD) from donor -> recipient
Donor_concentration_risk = HHI of donor across destinations (0-1) higher = more concentrated implies more risk
Strategic_alignment = share of donor funding to the recipient's primary GlobalCluster (0-1) - best-effort derived
Assumptions & notes:
recipient_nameis matched againstdestinationObjects.name(destination type "Location" or "Organization" or "Plan").strategic alignment is computed by comparing GlobalCluster names present in destinationObjects for the recipient vs donor.
HHI is calculated per donor across all destination names (locations/plans).
Examples
result <- analysis_portfolio_scores(flows,
               recipient_name="United Nations High Commissioner for Refugees",
                          top_n = 10)

print(result$plot)