A branded template for shiny dashboard
Installation
This package is not on yet on CRAN and to install it, you will need the pak package.
install.packages("pak")
pak::pkg_install("edouard-legoupil/unhcrshiny")
Usage
Simply call the function theme_shinydashboard_unhcr() within the dashboardBody of your app.
If you want to quickly create a shiny Dashboard, go and check the package {graveler}
You can also look at: ShinyDashboard Get Started and apply unhcrthemes on your plots!
Examples
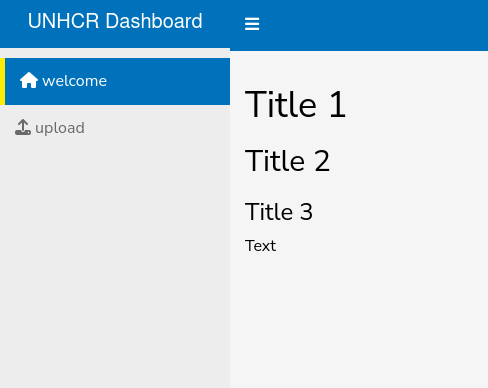
See a simple example here
## you can then run the app locally with
library(shiny)
library(shinydashboard)
library(unhcrshiny)

ui <- dashboardPage(
         dashboardHeader( title = "UNHCR Dashboard"),
         dashboardSidebar(
           sidebarMenu(
             menuItem(  "welcome", tabName = "welcome", icon = icon("house")),
             menuItem(  "upload", tabName = "upload", icon = icon("upload"))
           )
          ),
         dashboardBody(
           ## Get the theme here!!
           theme_shinydashboard_unhcr(),
           h1("Title 1"),
           h2("Title 2"),
           h3("Title 3"),
           p("Text"))
 )

server <- function(input, output) { }

shinyApp(ui, server)
An example with some content
## you can then run the app locally with
library(shiny)
library(shinydashboard)
library(unhcrshiny)

 ui <- dashboardPage(
    dashboardHeader(title = "UNHCR Dashboard"),
    dashboardSidebar(sidebarMenu(
      menuItem("welcome", tabName = "welcome", icon = icon("house")),
      menuItem("upload", tabName = "upload", icon = icon("upload"))
    )),
    dashboardBody(
      ## Get the theme here!!
      theme_shinydashboard_unhcr(),
      h1("Title 1: Example of branded charts"),
      shinydashboard::box(
        title = "primary bootstap box",
        status = "primary",
        solidHeader =FALSE,
        collapsible = TRUE,
        width = 12,
        footer = tags$a(href = "https://vidonne.github.io/unhcrthemes/articles/intro-unhcrthemes.html#donut-chart", "source"),
        plotOutput(outputId =  "plot0")
      ),
      h2("Title 2: bar Chart"),
      fluidRow(
        column(
          width = 6,
          shinydashboard::box(
            title = "info bootstap box",
            status = "info", # info Blue
            solidHeader =FALSE,
            collapsible = TRUE,
            width = 12,
            footer = tags$a(href = "https://vidonne.github.io/unhcrthemes/articles/intro-unhcrthemes.html#column-chart", "source"),
            plotOutput(outputId =  "plot1")
          )
        ),
        column(
          width = 6,
          shinydashboard::box(
            title = "success bootstap box",
            status = "success", # success Green
            solidHeader =FALSE,
            collapsible = TRUE,
            width = 12,
            footer = tags$a(href = "https://vidonne.github.io/unhcrthemes/articles/intro-unhcrthemes.html#bar-chart-with-data-label", "source"),
            plotOutput(outputId =  "plot2")
          )
        )
      ),
      h3("Title 3: Other examples"),
      fluidRow(
        column(
          width = 6,
          shinydashboard::box(
            title = "warning bootstap box",
            status = "warning", # warning Orange
            solidHeader =FALSE,
            collapsible = TRUE,
            width = 12,
            plotOutput(outputId =  "plot3"),
            footer = tags$a(href = "https://vidonne.github.io/unhcrthemes/articles/intro-unhcrthemes.html#population-pyramid",
                   "source")
          )
        ),
        column(
          width = 6,
          shinydashboard::box(
            title = "danger bootstap box",
            status = "danger", # danger Red
            solidHeader =FALSE,
            collapsible = TRUE,
            width = 12,
            plotOutput(outputId =  "plot4"),
            footer = tags$a(href = "https://vidonne.github.io/unhcrthemes/articles/intro-unhcrthemes.html#treemap",
                   "source")
          )
        )
      ) # endrow
    ) # dashboardBody
  )

server <- function(input, output) {
  ## https://vidonne.github.io/unhcrthemes/articles/intro-unhcrthemes.html


  output$plot0 <- renderPlot({
    df12 <- tribble(
      ~label,~Funding,
      "Received to date",144,
      "Gap",150)

    df12 |>
      mutate(p = Funding / sum(Funding),
             label2 = paste0("**$", Funding, " M**",
                             "<br>", label, " (",
                             round(100 * p, 1), "%)")) |>
      ggplot() +
      ggforce::geom_arc_bar(aes(x0 = 0,
                       y0 = 0,
                       r0 = 0.65,
                       r = 1,
                       amount = Funding,
                       fill = label),
                   size = 1,
                   color = "#FFFFFF",
                   stat = "pie") +
      ggtext::geom_richtext(x = c(1.45, -1.25), y = c(-0.3, 0.3),
                    aes(label = label2),
                    size = 3,
                    fill = NA,
                    label.color = NA) +
      ggtext::geom_richtext(x = 0, y = 0,
                    label = paste0("**$", sum(df12$Funding), " M**",
                                   "<br><span style='font-size:12pt'>Total required</span>"),
                    fill = NA,
                    label.color = NA,
                    size = 10) +
      scale_fill_unhcr_d(palette = "pal_unhcr") +
      scale_x_continuous(expand = expansion(c(0.3, 0.5))) +
      coord_fixed(clip = "off") +
      theme_unhcr(grid = FALSE, axis = FALSE,
                  axis_title = FALSE,
                  axis_text = FALSE,
                  legend = FALSE)
  })

  output$plot1 <- renderPlot({
    df1 <- tibble::tribble(
    ~year, ~nidp,
    "2010",24.98,
    "2011",22.44,
    "2012",26.39,
    "2013",33.34,
    "2014",37.87,
    "2015",40.52,
    "2016",40.29,
    "2017",39.98,
    "2018",41.34,
    "2019",45.70,
    "2020",48.03)
    ggplot(df1) +
      geom_col(aes(x = year, y = nidp),
               fill = unhcr_pal(n = 1, "pal_blue"),
               width = 0.8) +
      labs(title = "Globalement IDP displacement | 2010 - 2020",
           y = "Number of people (in million)",
           caption = "Source: UNHCR Refugee Data Finder\n© UNHCR, The UN Refugee Agency") +
      scale_y_continuous(expand = expansion(c(0, 0.1))) +
      theme_unhcr(grid = "Y",
                  axis = "x",
                  axis_title = "y")
  })

  output$plot2 <- renderPlot({
  df2 <- tibble::tribble(
    ~country,~displaced,
    "Eritrea",522000,
    "Central African Rep.",642000,
    "Sudan",788000,
    "Somalia",815000,
    "DRC",840000,
    "Myanmar",1103000,
    "South Sudan",2189000,
    "Afghanistan",2595000,
    "Venezuela",4027000,
    "Syria",6690000)

    df2 |>
      ggplot() +
      geom_col(aes(x = displaced/1e6,
                   y = reorder(country, displaced)),
               fill = unhcr_pal(n = 1, "pal_blue"),
               width = 0.8) +
      geom_text(aes(x = displaced/1e6,
                    y = reorder(country, displaced),
                    label = round(displaced/1e6, 2)),
                hjust = -0.5,
                size = 3) +
      labs(title = "People displaced across borders by country of origin | 2020",
           subtitle = "Number of people (million)",
           caption = "Source: UNHCR Refugee Data Finder\n© UNHCR, The UN Refugee Agency") +
      scale_x_continuous(expand = expansion(c(0, 0.1))) +
      theme_unhcr(grid = FALSE,
                  axis = "y",
                  axis_text = "y",
                  axis_title = FALSE)
  })

  output$plot3 <- renderPlot({
    df8 <- tibble::tribble(
      ~ages,~male,~female,
      "0-4",0.06,0.06,
      "5-11",0.09,0.08,
      "12-17",0.06,0.06,
      "18-59",0.27,0.25,
      "60+",0.03,0.03) |>
      dplyr::mutate(ages = factor(ages,
                           levels = c("0-4", "5-11", "12-17", "18-59", "60+"),
                           ordered = TRUE))


    ggplot() +
      geom_col(data = df8,
               aes(-male, ages, fill = "Male"),
               width = 0.7) +
      geom_col(data = df8,
               aes(female, ages, fill = "Female"),
               width = 0.7) +
      geom_text(data = df8,
                aes(-male, ages, label = scales::percent(abs(male))),
                hjust = 1.25,
                size = 3) +
      geom_text(data = df8,
                aes(female, ages, label = scales::percent(female)),
                hjust = -0.25,
                size = 3) +
      labs(title = "Demographics of people who have been forcibly displaced | 2020",
           caption = "Note: figures do not add up to 100 per cent due to rounding
Source: UNHCR Refugee Data Finder
© UNHCR, The UN Refugee Agency") +
      scale_x_continuous(expand = expansion(c(0.1, 0.1))) +
      scale_fill_manual(values = stats::setNames(unhcr_pal(n = 3, "pal_unhcr")[c(2, 1)],
                                          c("Male", "Female"))) +
      theme_unhcr(grid = FALSE,
                  axis = FALSE,
                  axis_text = "y",
                  axis_title = FALSE)
  })


  output$plot4 <- renderPlot({
    df13 <- tribble(
      ~region,~workforce,
      "West and Central Africa",5,
      "Southern Africa",11,
      "Middle East/North Africa",19,
      "Europe",10,
      "East and Horn of \nAfrica, and Great Lakes",22,
      "Asia and Pacific",12,
      "Americas",11,
      "HQ", 9)

    df13 |>
      mutate(label = paste0(workforce, "%\n", region)) |>
      ggplot(aes(area = workforce)) +
      treemapify::geom_treemap(color = "#FFFFFF",
                   size = 1,
                   fill = unhcr_pal(n = 1, "pal_blue"),
                   start = "topleft") +
      treemapify::geom_treemap_text(aes(label = label),
                        color = "#FFFFFF",
                        grow = FALSE,
                        start = "topleft",
                        family = "Lato") +
      labs(title = "UNHCR global workforce by region | 2020",
           caption = "Note: figures do not add up to 100 per cent du to rounding
Source: UNHCR Refugee Data Finder
© UNHCR, The UN Refugee Agency") +
      theme_unhcr(axis = FALSE,
                  axis_title = FALSE,
                  grid = FALSE)
  })

  }

shinyApp(ui, server)