Show a flow diagram of implementing partners
Source:R/show_implementing_partners_flow.R
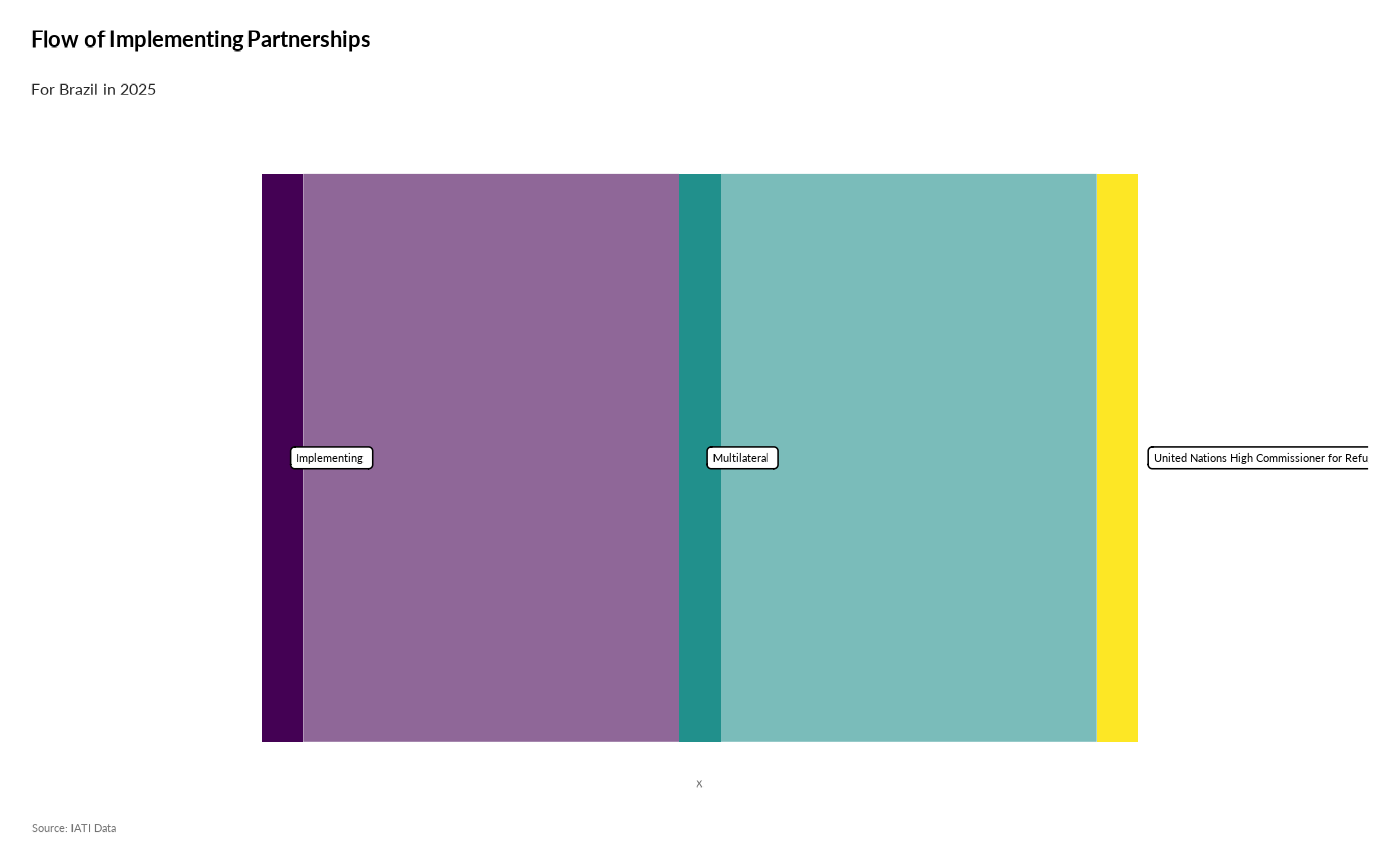
show_implementing_partners_flow.RdThis function creates a Sankey diagram to visualize the relationships between implementing partner roles, their organization types, and their names.
Usage
show_implementing_partners_flow(
  year,
  ctr_name = NULL,
  programme_lab = NULL,
  iati_identifier_ops = NULL,
  top_n = 15
)