Plot donor transaction description
Source:R/show_donor_transaction_desc.R
show_donor_transaction_desc.RdCreates a visualization showing the breakdown of a donor's funding by transaction description. If only `by` is NULL, it returns a bar chart of transaction descriptions. If `by` is provided, it returns a heatmap cross-tabulation of transaction description vs the specified dimension.
Usage
show_donor_transaction_desc(
  donor_name,
  by = NULL,
  year = NULL,
  programme_lab = NULL,
  iati_identifier_ops = NULL,
  ctr_name = NULL,
  top_n = 10
)
Arguments
- donor_name
Character. The name of the donor to plot.
- by
Optional character. A second category to create a heatmap with transaction description. One of "unhcr_region", "year", "earmarking_name", or "ctr_name".
- year
Optional numeric/integer vector. Year(s) to filter on.
- programme_lab
Optional character vector. Filter for programme name.
- iati_identifier_ops
Optional character vector. Filter for operation ID.
- ctr_name
Optional character vector. Filter for country name.
- top_n
Integer. The number of top transaction descriptions to show.
Examples
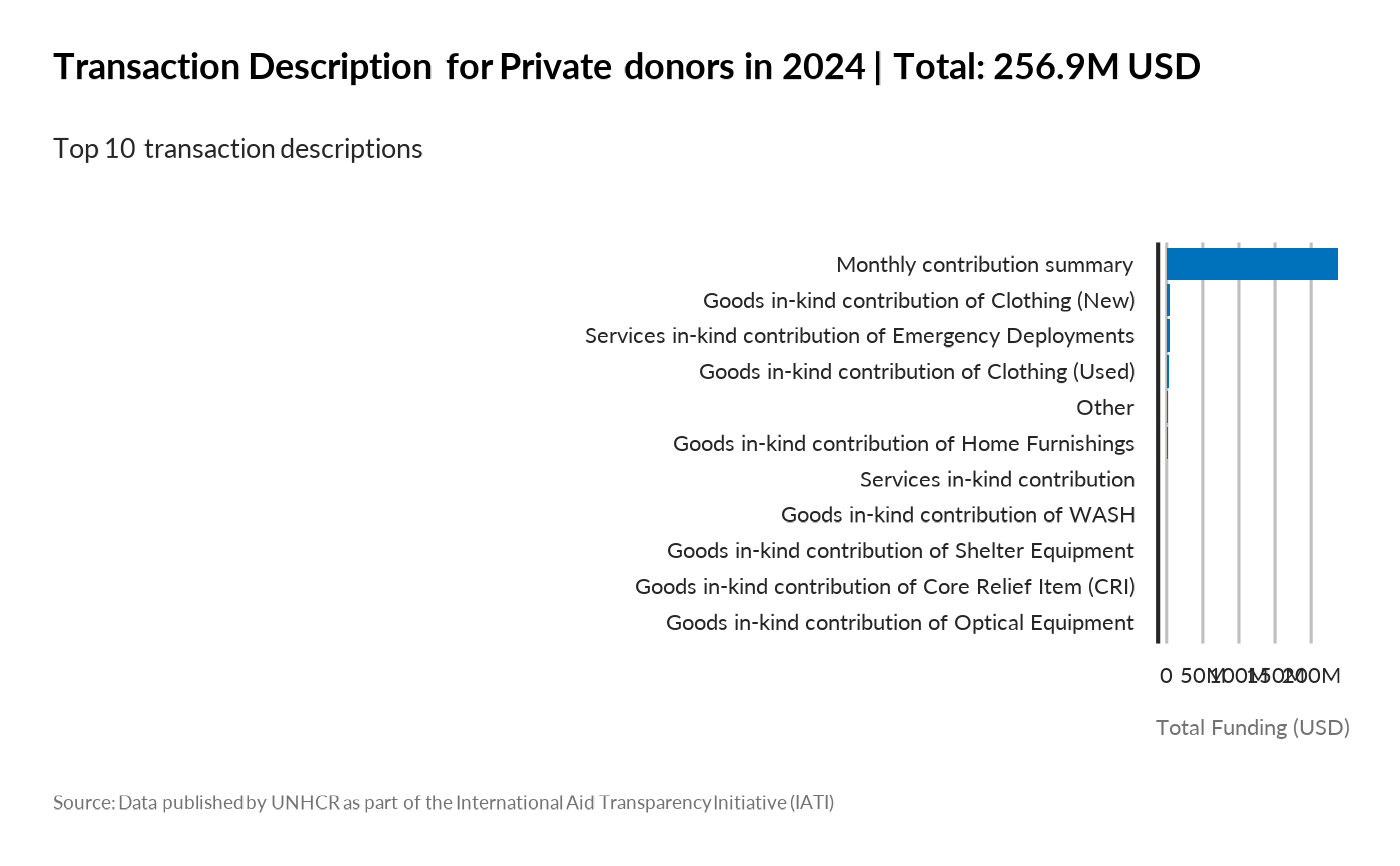
# Show top 10 transaction descriptions for a donor
show_donor_transaction_desc(
donor_name = "Private donors",
year = 2024,
top_n = 10
)
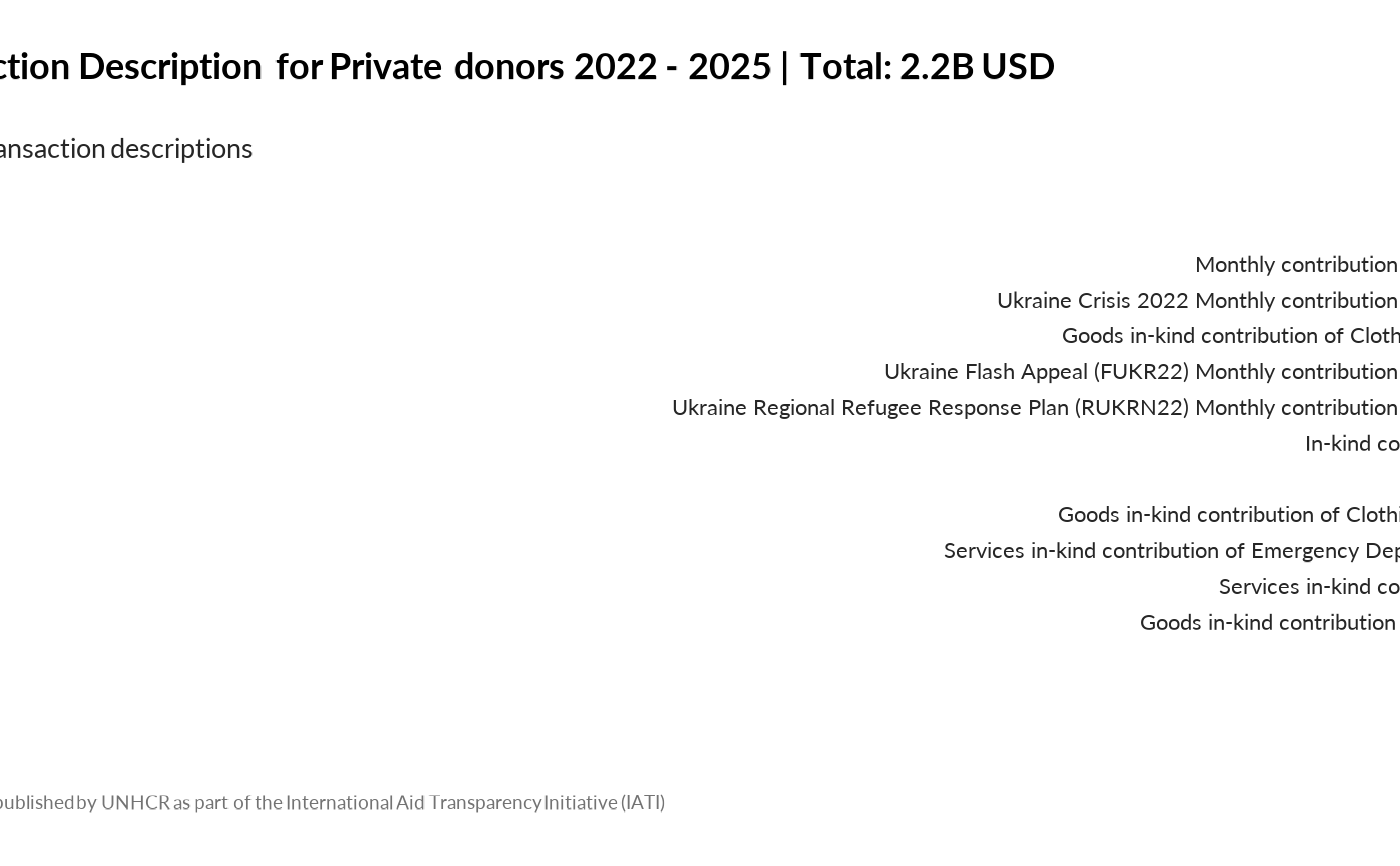
 # Show top 10 transaction descriptions for a donor
show_donor_transaction_desc(
donor_name = "Private donors",
year = 2022:2025,
top_n = 10
)
# Show top 10 transaction descriptions for a donor
show_donor_transaction_desc(
donor_name = "Private donors",
year = 2022:2025,
top_n = 10
)
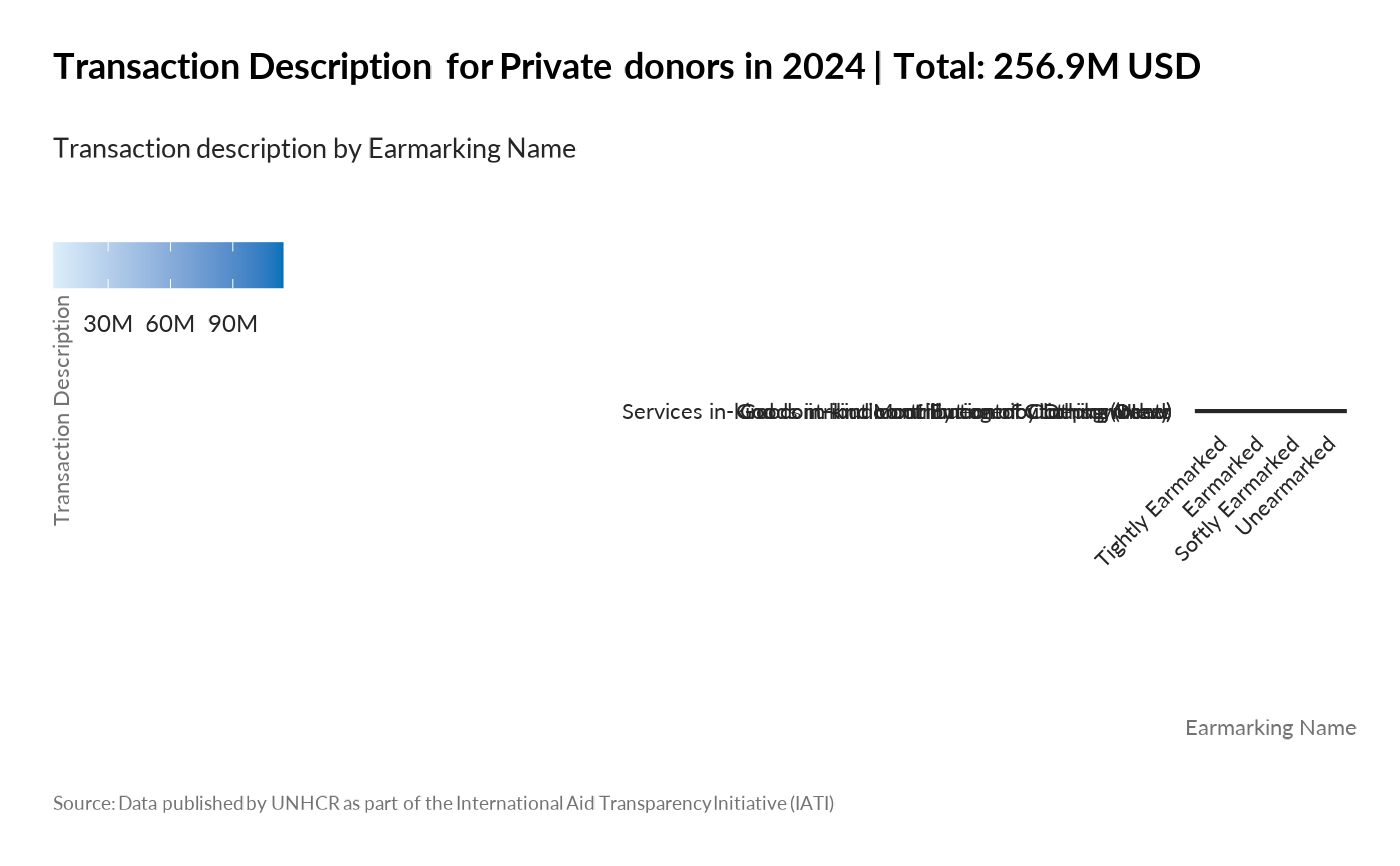
 # Show earmarking breakdown with proper color coding
show_donor_transaction_desc(
donor_name = "Private donors",
by = "earmarking_name",
year = 2024,
top_n = 4 # Shows all 4 earmarking types
)
# Show earmarking breakdown with proper color coding
show_donor_transaction_desc(
donor_name = "Private donors",
by = "earmarking_name",
year = 2024,
top_n = 4 # Shows all 4 earmarking types
)
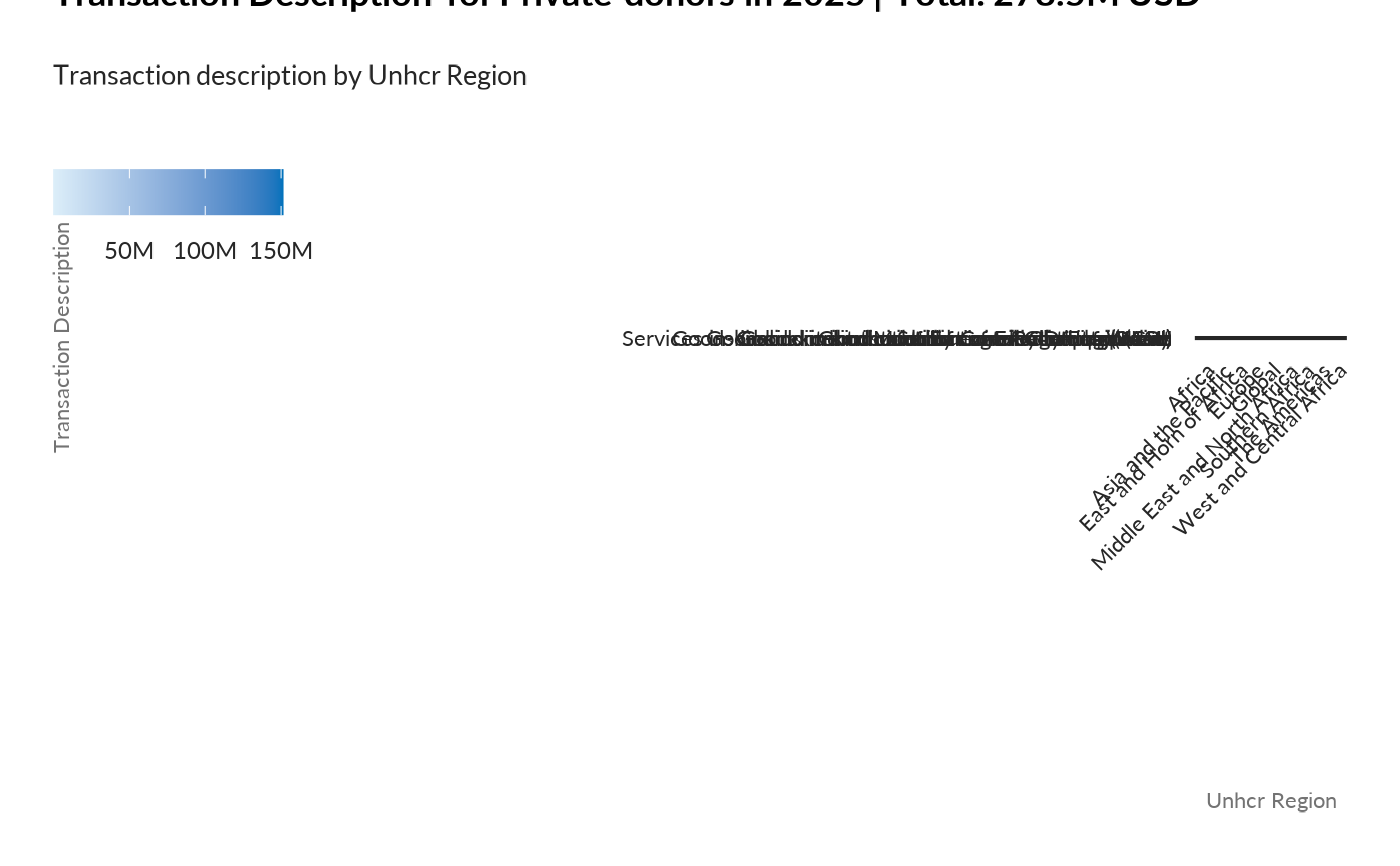
 # Show funding by region
show_donor_transaction_desc(
donor_name = "Private donors",
by = "unhcr_region",
year = 2025,
top_n = 8
)
# Show funding by region
show_donor_transaction_desc(
donor_name = "Private donors",
by = "unhcr_region",
year = 2025,
top_n = 8
)