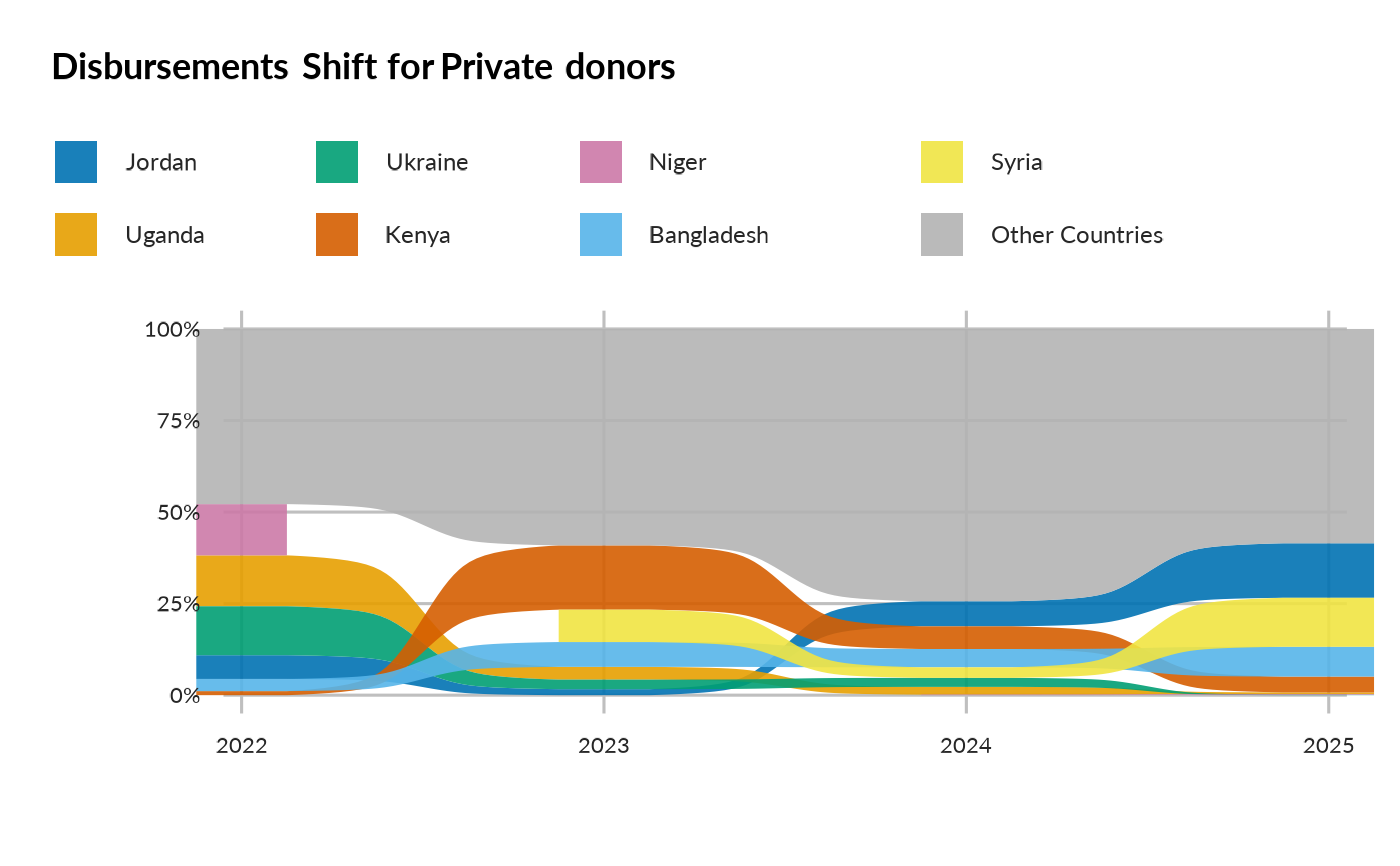
Plot donor geographic priority shift over time (alluvial, CVD-safe colors + correct labels)
Source:R/show_donor_geographic_priority_shift.R
show_donor_geographic_priority_shift.RdPlot donor geographic priority shift over time (alluvial, CVD-safe colors + correct labels)
Usage
show_donor_geographic_priority_shift(
  donor_name,
  top_n_countries = 5,
  start_year = NULL,
  end_year = NULL,
  verbose = TRUE
)