Plot donor funding over time (bar chart)
Source:R/show_donor_funding_over_time.R
show_donor_funding_over_time.RdThis function plots the funding from a specific donor over time as a bar chart. If `by` is not "global", the plot is faceted by the corresponding `by` variable.
Usage
show_donor_funding_over_time(
  donor_name,
  year = NULL,
  by = "global",
  programme_lab = NULL,
  iati_identifier_ops = NULL,
  ctr_name = NULL,
  top_n_countries = 10
)
Arguments
- donor_name
The name of the donor to plot.
- year
A numeric value or a vector of numeric values to filter on year.
- by
The category to group by. One of "global", "region", "country", "earmarking_name".
- programme_lab
A character vector corresponding to the name of the programme.
- iati_identifier_ops
A character vector corresponding to the name of the operation.
- ctr_name
A character vector corresponding to the name of the country.
- top_n_countries
The number of top countries to show when `by = "country"`.
Examples
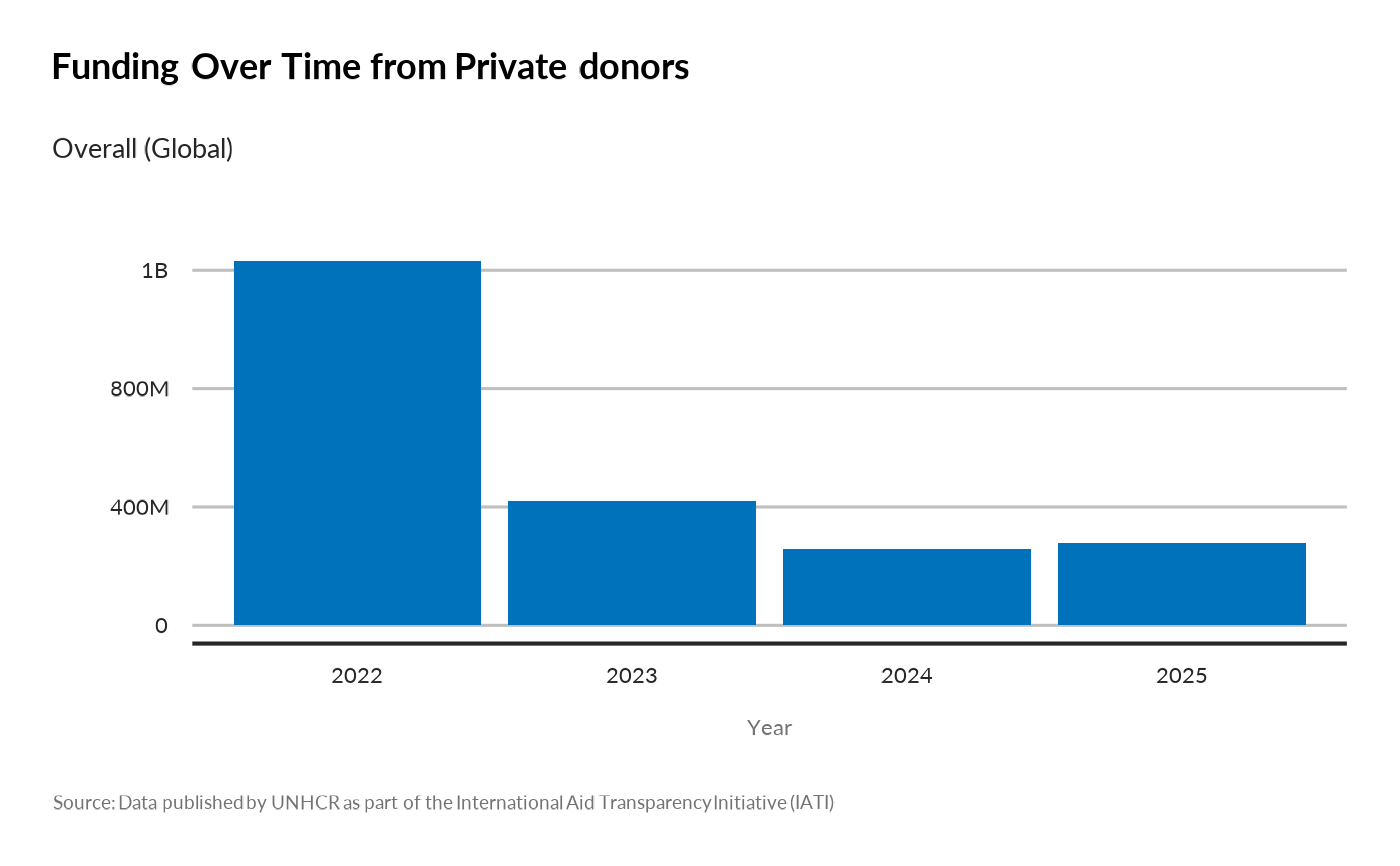
show_donor_funding_over_time(donor_name = "Private donors",
year = c(2022, 2023, 20234, 2025),
by = "global" )
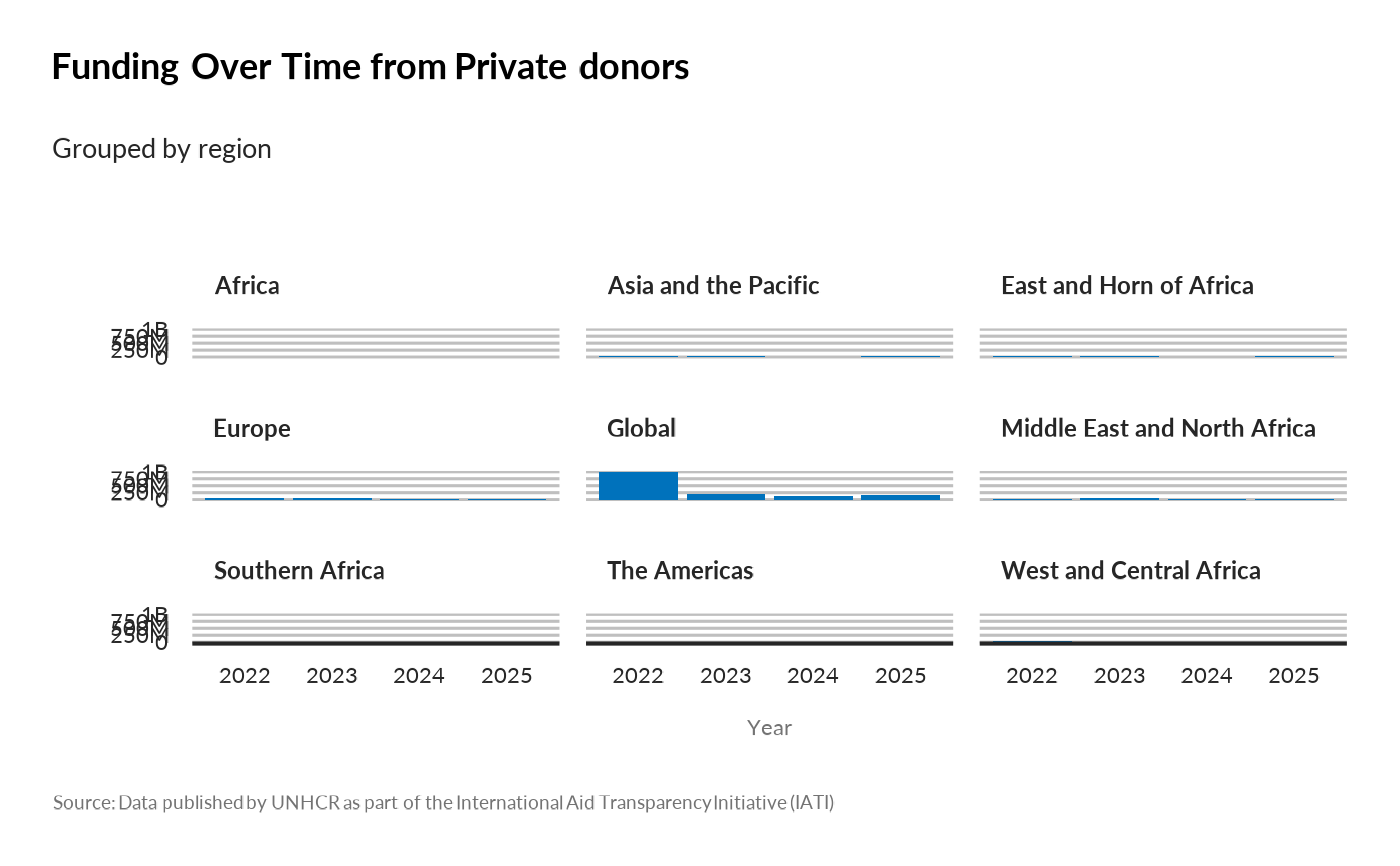
 show_donor_funding_over_time(donor_name = "Private donors",
year = c(2022, 2023, 20234, 2025),
by = "region" )
show_donor_funding_over_time(donor_name = "Private donors",
year = c(2022, 2023, 20234, 2025),
by = "region" )
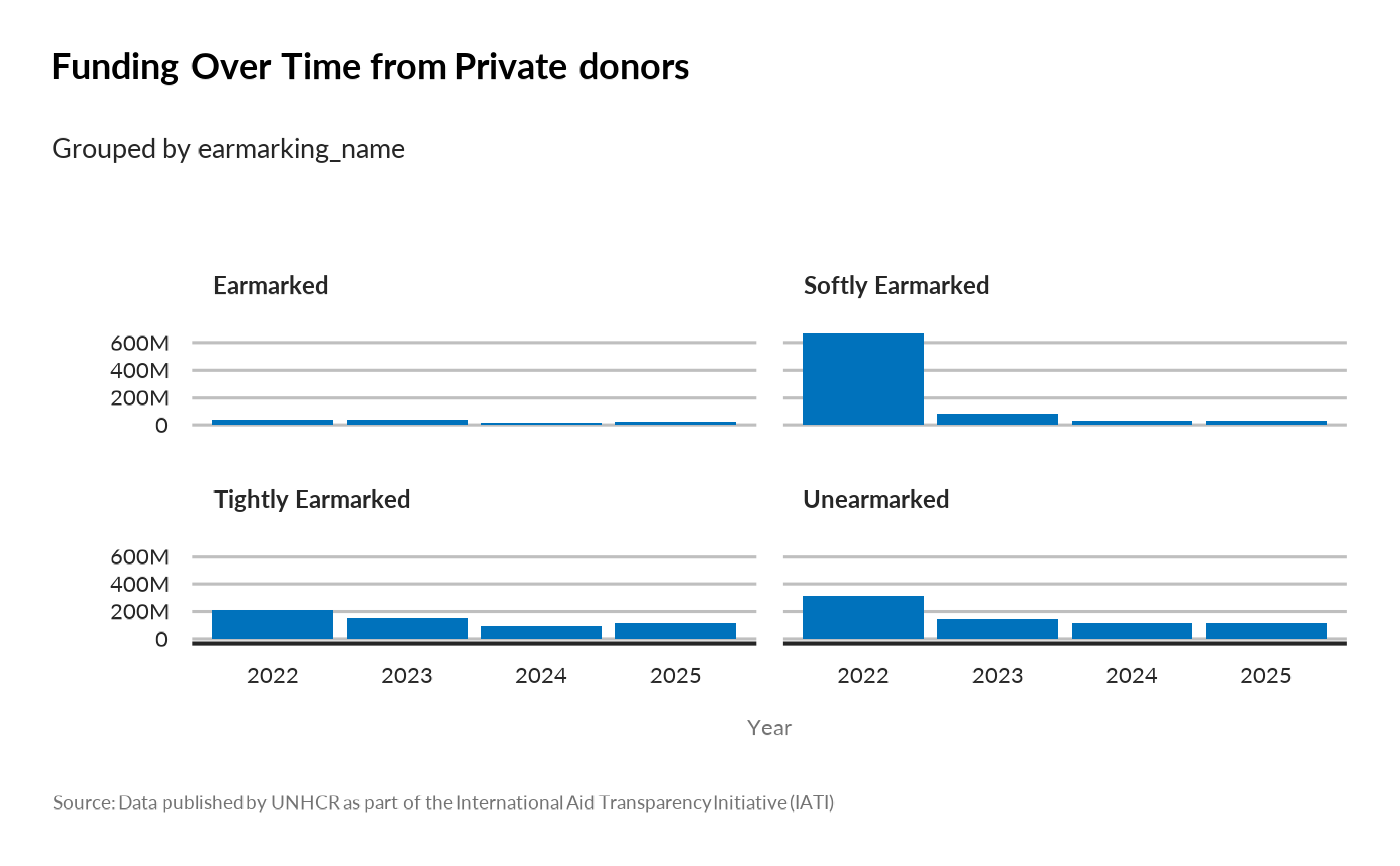
 show_donor_funding_over_time(donor_name = "Private donors",
year = c(2022, 2023, 20234, 2025),
by = "earmarking_name" )
show_donor_funding_over_time(donor_name = "Private donors",
year = c(2022, 2023, 20234, 2025),
by = "earmarking_name" )
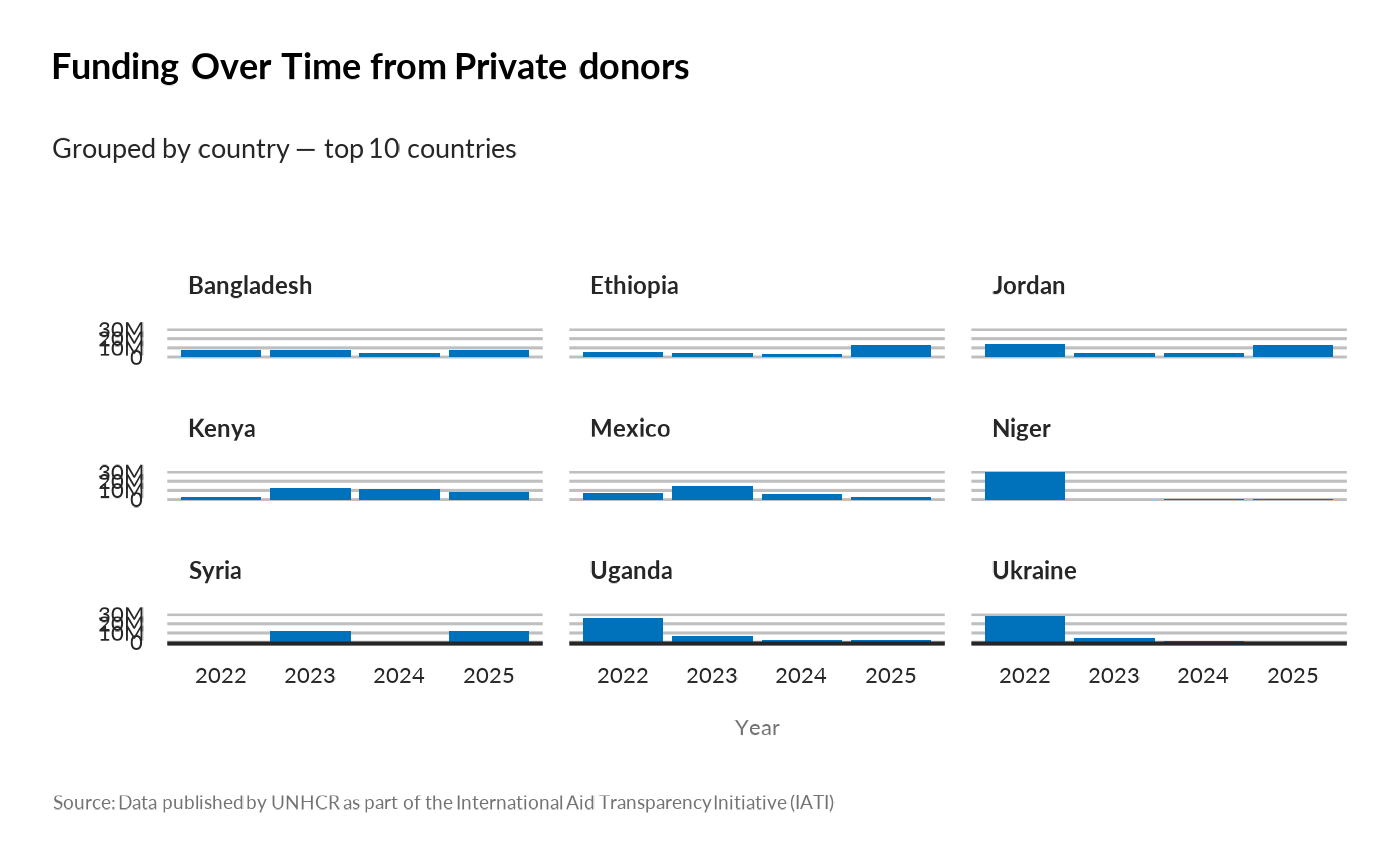
 show_donor_funding_over_time(donor_name = "Private donors",
year = c(2022, 2023, 20234, 2025),
by = "country",
top_n_countries = 10)
show_donor_funding_over_time(donor_name = "Private donors",
year = c(2022, 2023, 20234, 2025),
by = "country",
top_n_countries = 10)