Show donor earmarking profiles
Source:R/show_donor_earmarking_profile.R
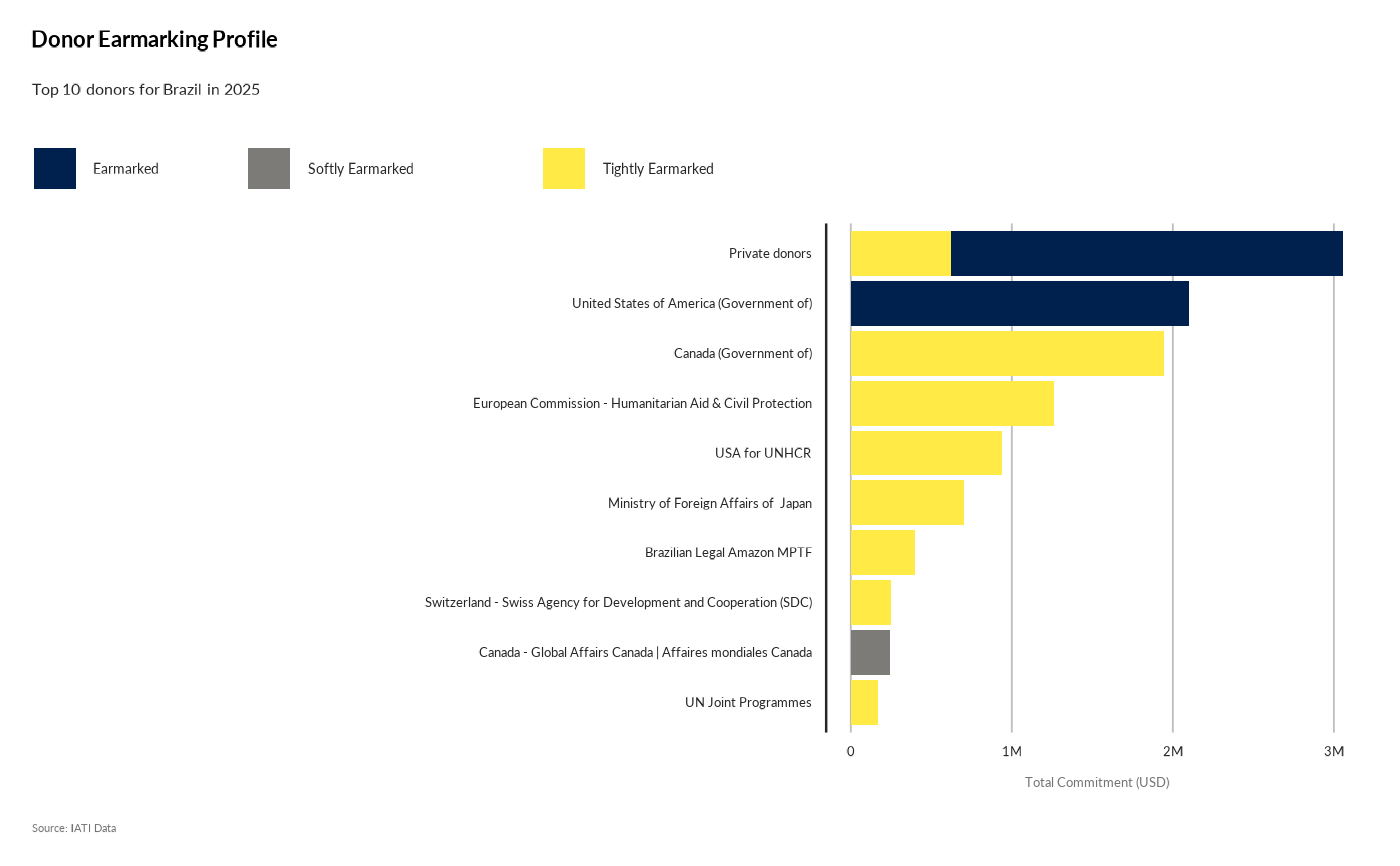
show_donor_earmarking_profile.RdThis function creates a stacked bar chart to show the earmarking profile of the top N donors.
Usage
show_donor_earmarking_profile(
  year,
  ctr_name = NULL,
  programme_lab = NULL,
  iati_identifier_ops = NULL,
  top_n = 10
)