Plot donor earmarking flexibility over time
Source:R/show_donor_earmarking_flexibility_over_time.R
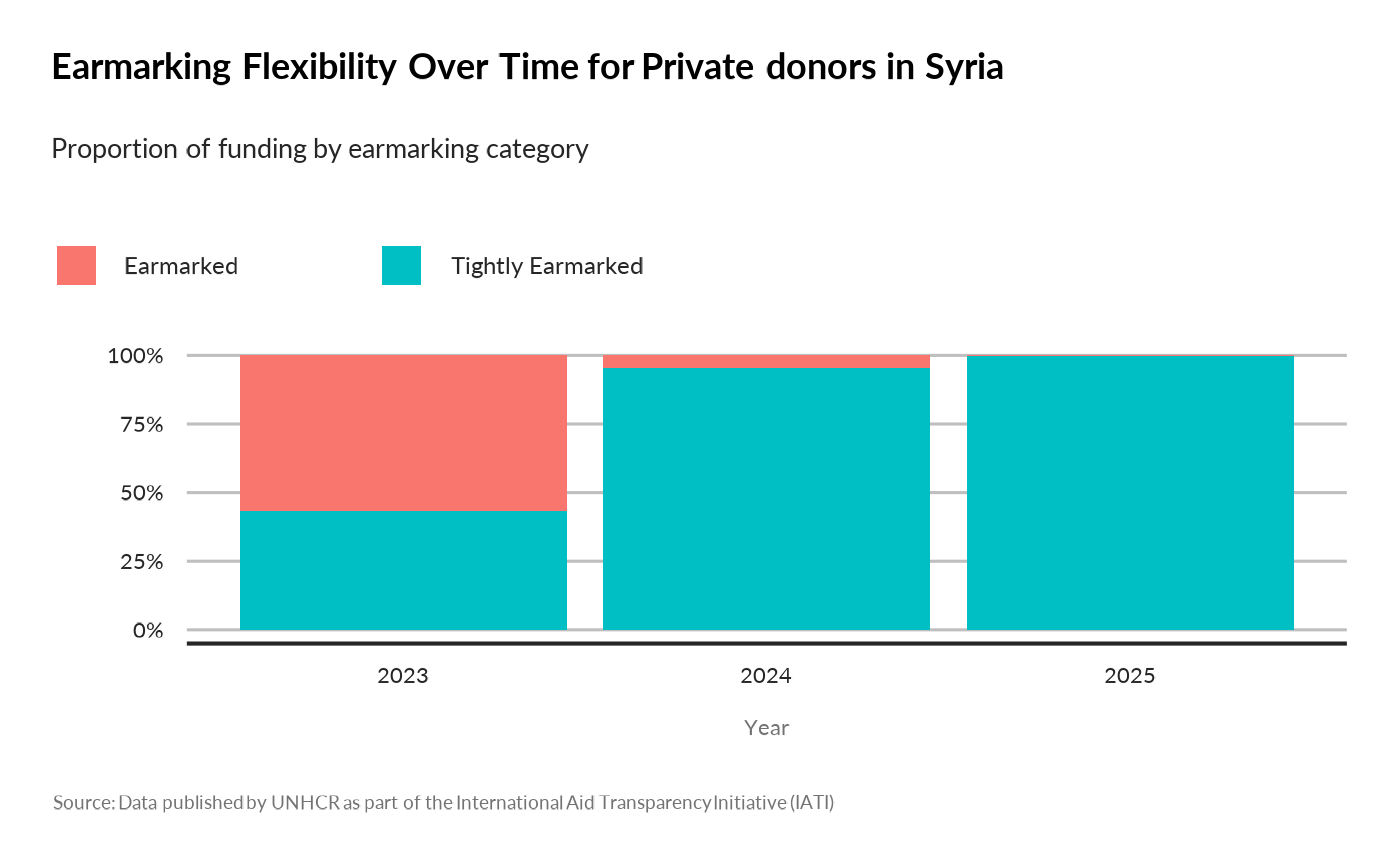
show_donor_earmarking_flexibility_over_time.RdThis function creates a stacked bar chart showing the proportion of each earmarking category for a specific donor over several years.
Usage
show_donor_earmarking_flexibility_over_time(
  donor_name,
  programme_lab = NULL,
  iati_identifier_ops = NULL,
  ctr_name = NULL
)