Plot earmarking composition for a donor (stacked bar chart)
Source:R/show_donor_earmarking.R
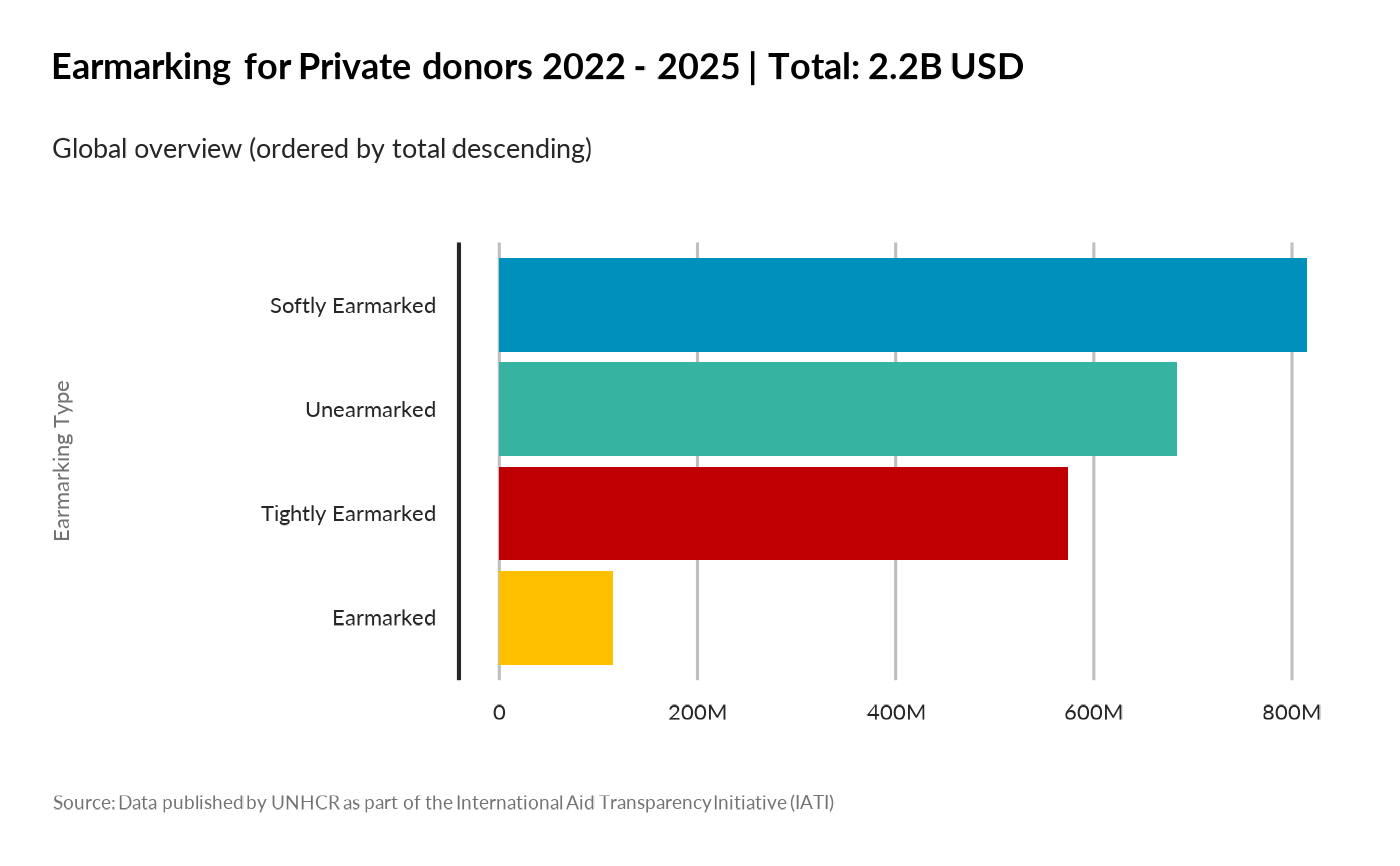
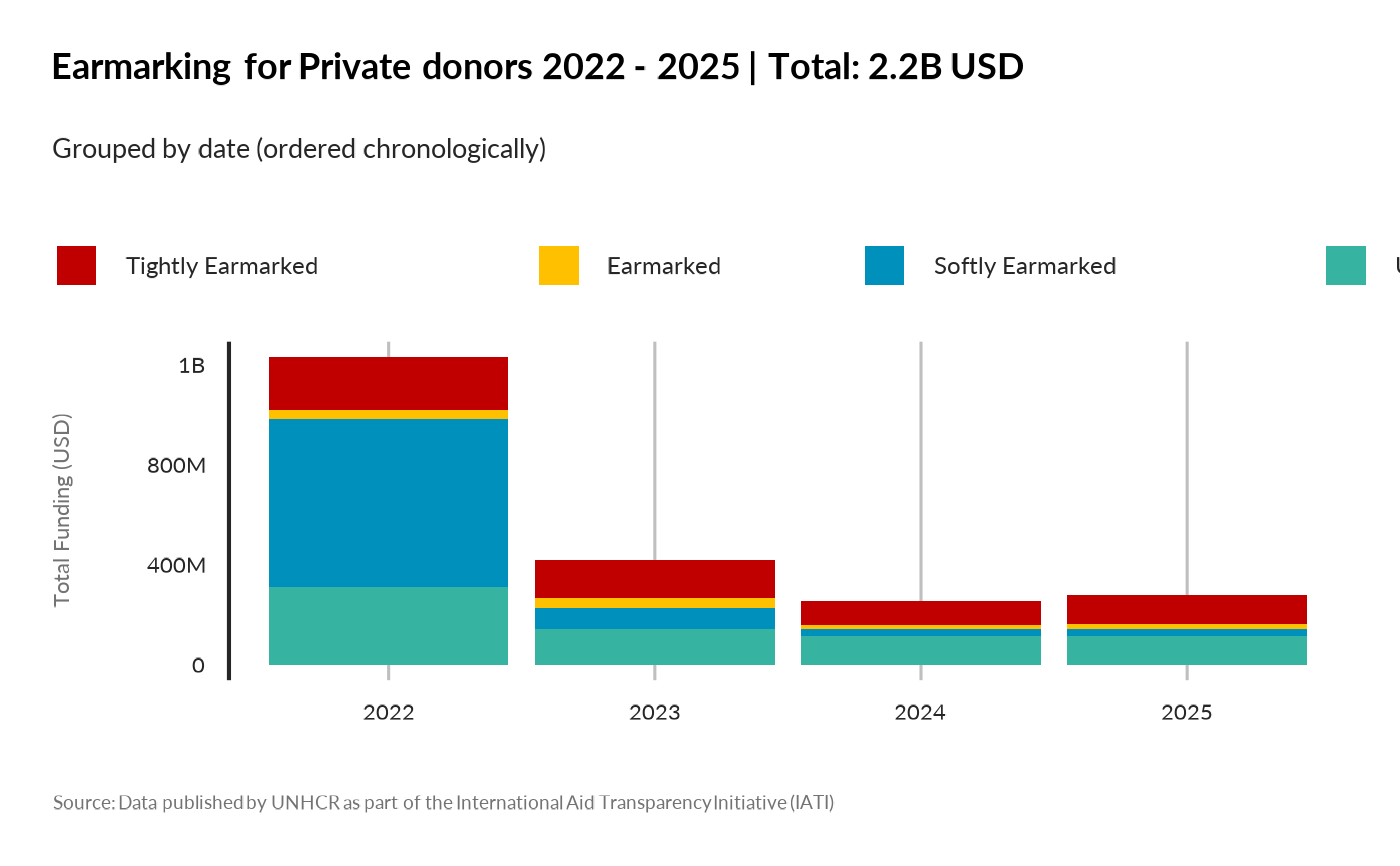
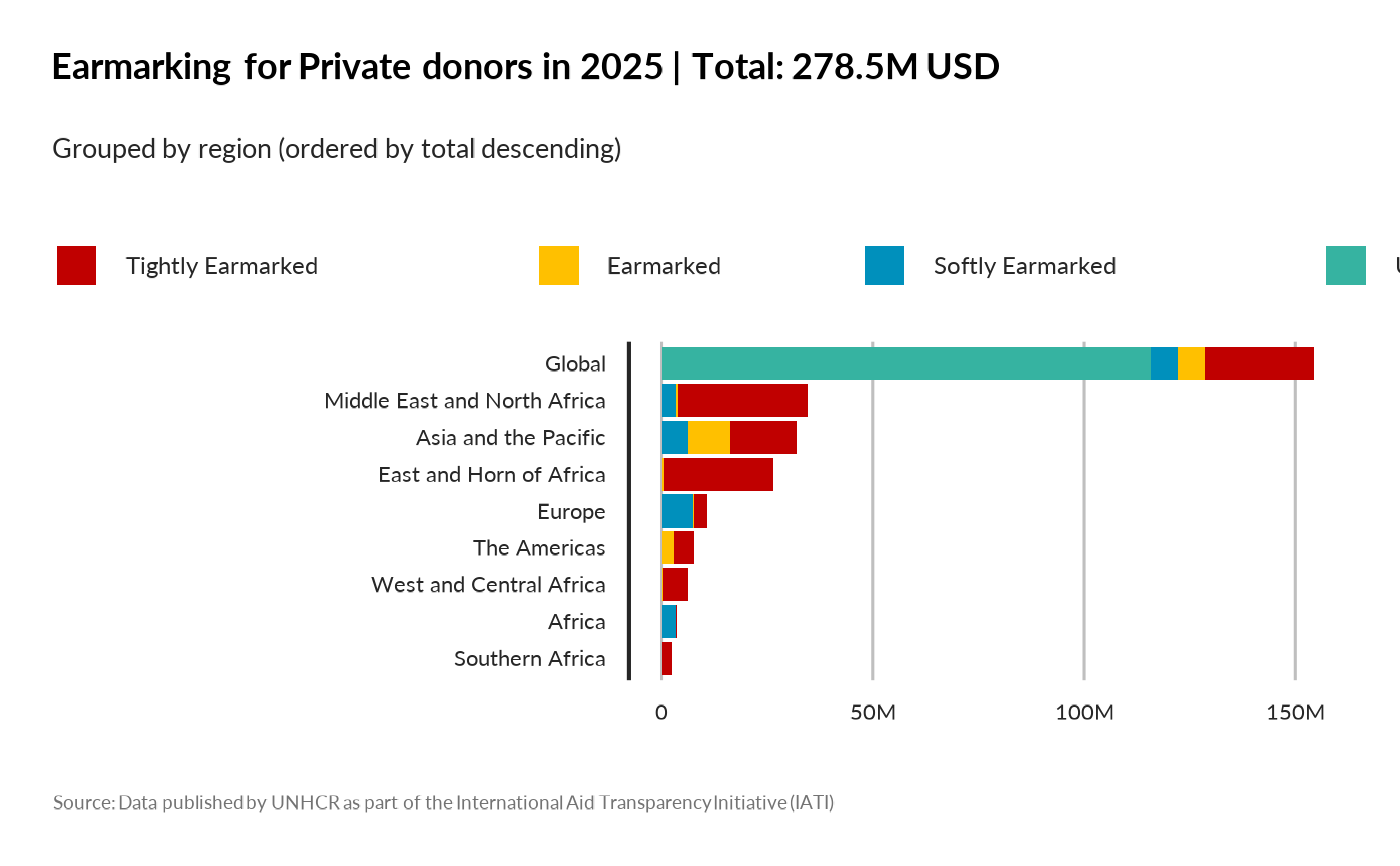
show_donor_earmarking.RdThis function plots the earmarking composition of incoming commitments for a donor. Depending on `by`, it shows a single global bar chart, bars by year, or stacked bars by region/country/sector. All bar charts are ordered by total descending amount, except for date grouping which is ordered chronologically.
Usage
show_donor_earmarking(
  donor_name,
  year = NULL,
  by = c("global", "date", "region", "country", "sector"),
  programme_lab = NULL,
  iati_identifier_ops = NULL,
  ctr_name = NULL
)
Arguments
- donor_name
The name of the donor to plot.
- year
A numeric value or a vector of numeric values to filter on year.
- by
Grouping dimension: one of "global", "date", "region", "country", "sector".
- programme_lab
A character vector of programme labels to filter on.
- iati_identifier_ops
A character vector of operation identifiers to filter on.
- ctr_name
A character vector of country names to filter on.