Plot donor regional and programme focus as a treemap
Source:R/plot_donor_regional_focus_treemap.R
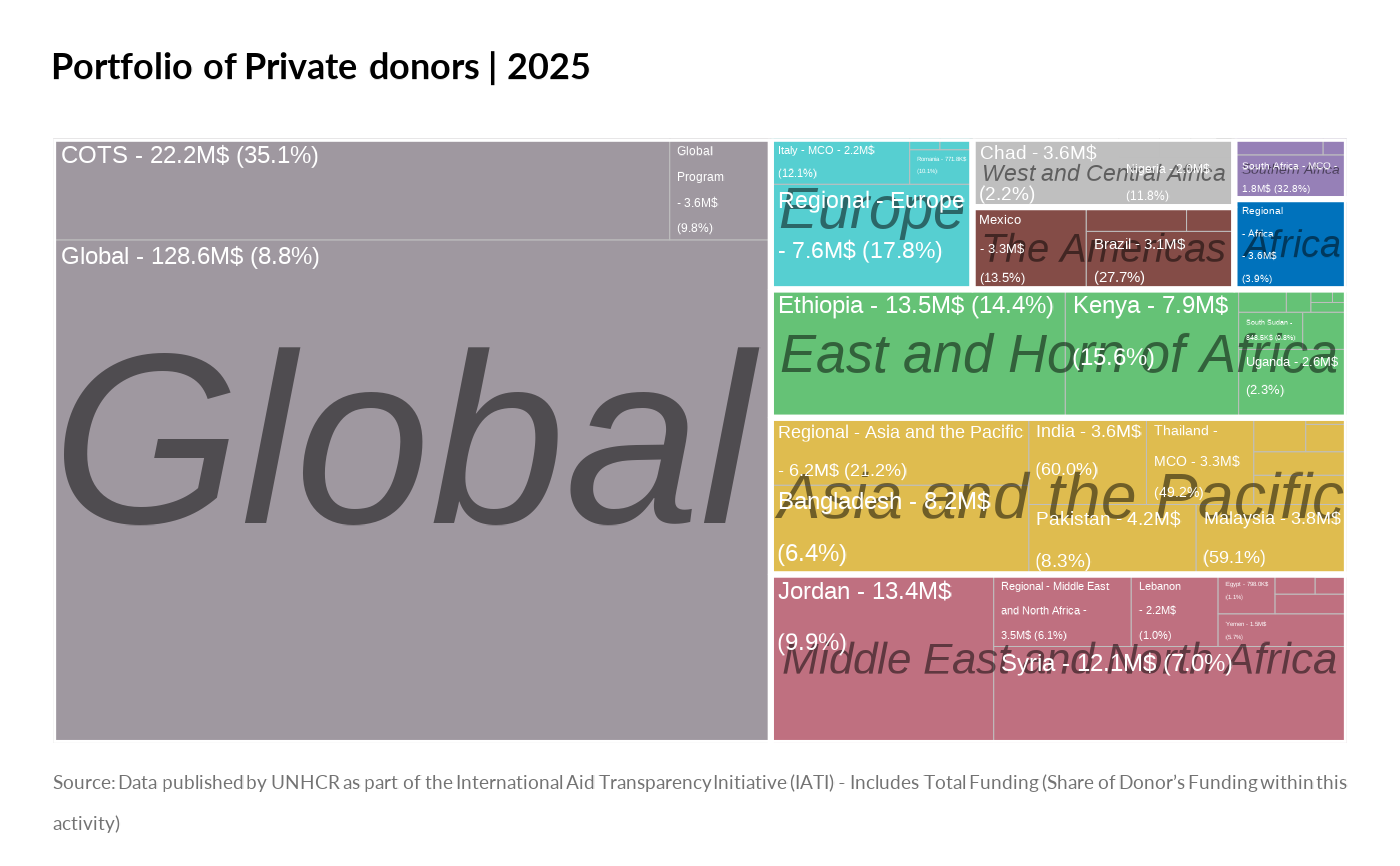
plot_donor_regional_focus_treemap.RdThis function generates a treemap visualization showing a donor's funding allocation across UNHCR regions and within those regions, by programme. The size of each treemap tile can represent either the absolute funding amount or the share of the donor's total funding for that programme within a region.
Arguments
- donor_name
Character. The name of the donor to analyze.
- year
Numeric or integer vector. Year(s) to filter the data.
- measure_type
Character. One of "total_amount_usd" (default) or "share". - "total_amount_usd": Tile size represents the absolute USD amount. - "share": Tile size represents the share of the donor's total funding that goes to a specific programme within a specific UNHCR region.
- label_font_size
Numeric. Base font size for treemap labels.