This function takes a ggplot2 object and generates a storytelling narrative. It now uses a modular architecture (extract_structure, profile_data, generate_description).
Usage
generate_plot_story(
  plot,
  max_tokens = 300,
  provider = NULL,
  model = NULL,
  max_tokens_short_desc = 30,
  max_tokens_long_desc = 500
)
Arguments
- plot
A `ggplot` object.
- max_tokens
Max tokens for description.
- provider
LLM provider.
- model
LLM model.
- max_tokens_short_desc
Maximum token limit for the short desc - typically to be used for a chart subtitle
- max_tokens_long_desc
Maximum token limit for the short desc - typically to be used for a long narrative illustration
Examples
library(ggplot2)
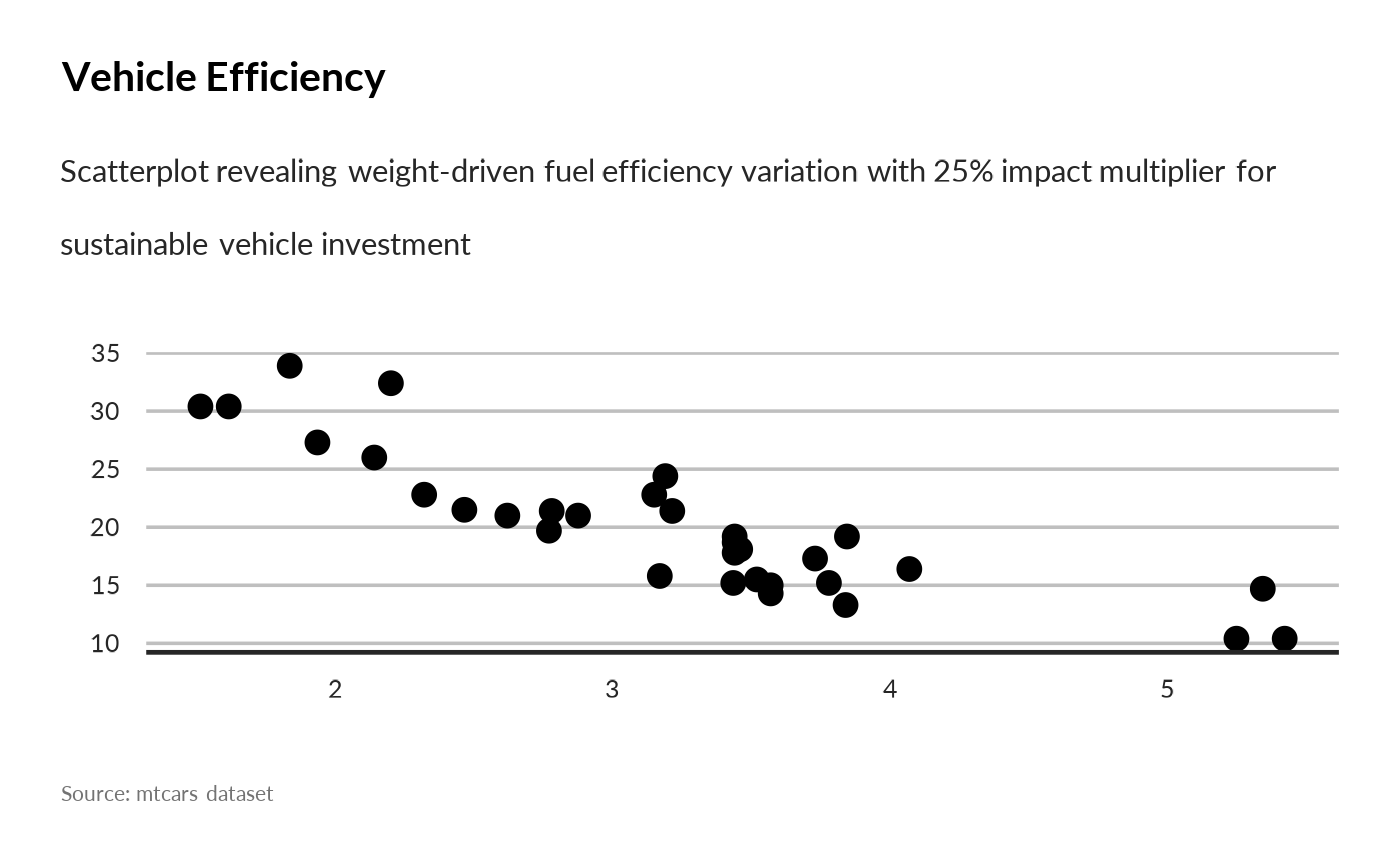
p <- ggplot(mtcars, aes(x = wt, y = mpg)) +
geom_point() +
unhcrthemes::theme_unhcr(grid = "Y", axis = "X", axis_title = FALSE, font_size = 23) +
labs(
title = "Vehicle Efficiency",
subtitle = "Fuel consumption vs weight",
caption = "Source: mtcars dataset"
)
# generate_plot_story(p, provider = "ollama", model = "deepseek-r1")
story <- generate_plot_story(
p,
provider = "azure",
model = "gpt-4.1-mini",
max_tokens_short_desc = 30,
max_tokens_long_desc= 500
)
# To use as subtitle:
p + ggplot2::labs(subtitle = story$short_desc)