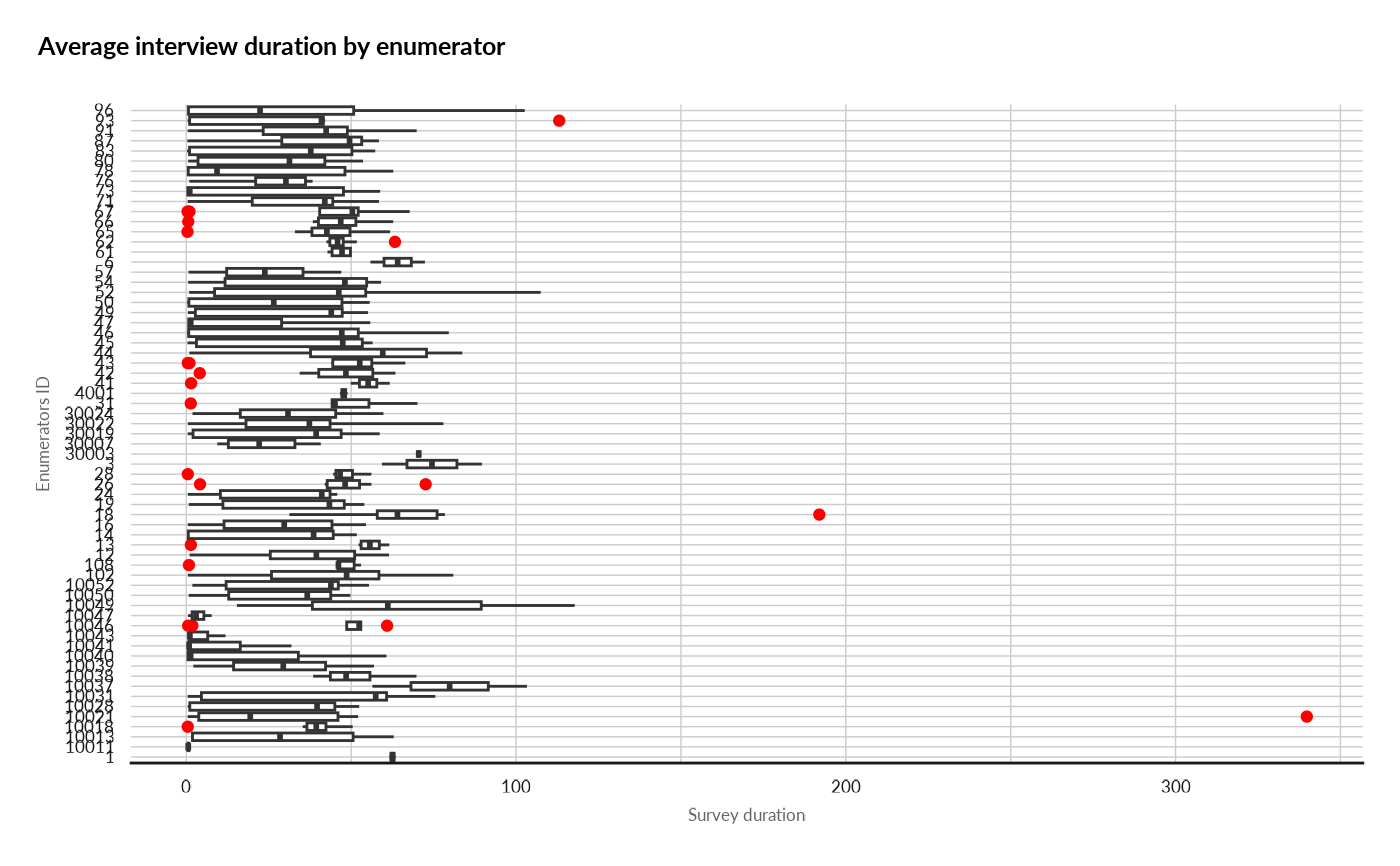
Check the average interview duration by enumerator
Source:R/enumeratorsurveysduration.R
enumeratorSurveysDuration.RdThis function display the average interview duration per enumerator.
Arguments
- ds
dataset containing the survey (from kobo): labelled data.frame
- dates
name of the fields where the information about the start and end date of the survey is stored: list of string (c('start_date','end_date'))
- enumeratorID
name of the field where the enumerator ID is stored: string
- checkperiod
if not null number of day before today when the check should be made
- surveyConsent
name of the field in the dataset where the survey consent is stored: string
- consentForValidSurvey
value defined in the kobo form to acknowledge the surveyed person gave his consent: string
Value
result a list that includes: * dst same dataset as the inputed one but with survey marked for deletion if errors are found and delete=TRUE (or NULL) * ret_log list of the errors found (or NULL) * var a list of value (or NULL) * graph graphical representation of the results (or NULL)
Examples
load(system.file("sample_dataset.RData", package = "HighFrequencyChecks"))
ds <- sample_dataset
dates <- c("survey_start","end_survey")
enumeratorID <- "enumerator_id"
result <- enumeratorSurveysDuration(ds = ds,
                                                          dates=dates,
                                                          enumeratorID=enumeratorID)
knitr::kable(head(result[["ret_log"]], 10))
#>
#>
#> | enumeratorID| duration_mean| overall_avg_duration| perc_diff_avg|
#> |------------:|-------------:|--------------------:|-------------:|
#> |            1|         62.54|                35.89|         74.25|
#> |            3|         74.50|                35.89|        107.58|
#> |            6|         64.10|                35.89|         78.60|
#> |           12|         36.18|                35.89|          0.81|
#> |           13|         47.65|                35.89|         32.77|
#> |           14|         29.03|                35.89|        -19.11|
#> |           16|         28.35|                35.89|        -21.01|
#> |           18|         77.40|                35.89|        115.66|
#> |           19|         31.89|                35.89|        -11.15|
#> |           24|         28.82|                35.89|        -19.70|
print(result[["graph"]])